Ear movements reveal new clues in mouse facial responses
Facial video, keypoint tracking and VTA recordings identify ear motion as a prominent discriminator of stimulus valence; VTA optical inhibition mainly changes this local feature.

What changes on a mouse’s face when it tastes sweetness or encounters an aversive stimulus? Subtle ear angles, mouth inclination and whisker movements can form different response patterns. An Advanced Science study analyzes facial video from head-fixed adult male mice and relates it to ventral tegmental area, or VTA, population activity. Ear motion stands out both for distinguishing stimulus valence and for its response to neural modulation.
Ear dynamics contribute prominently to classification. VTA dopamine and GABA populations correlate with positive and negative prototypes respectively; optical inhibition changes ear angles without significant overall-similarity or mouth-measure changes.
Contents · 7 sections
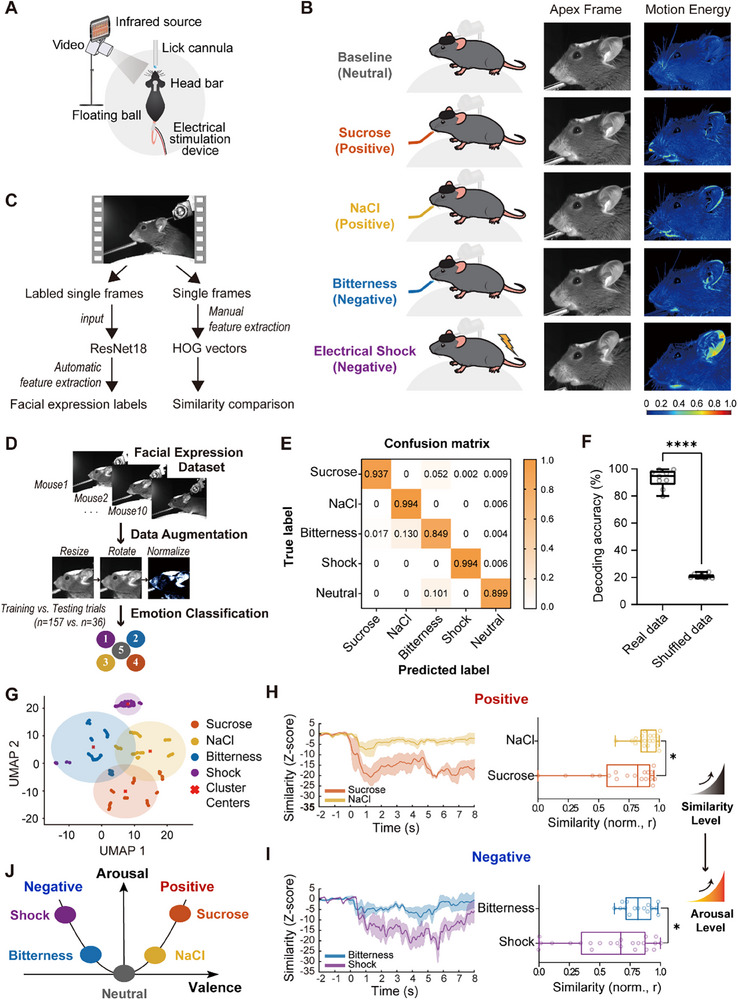
Four stimuli produce different facial patterns
Facial responses to sucrose, dilute salt solution, bitterness and tail shock are compared. The former pair represents reward-associated positive contexts and the latter aversion-associated negative contexts. Video changes are prominent around ears, mouth and whiskers.
A classifier achieves about ninety-three percent accuracy on held-out trials and performs much worse with shuffled labels. Edge-orientation features also place same-valence stimulus images closer together, revealing structure shared across distinct stimuli.
Source: Chen Y et al. · Advanced science (Weinheim, Baden-Wurttemberg, Germany) · CC BY
Original figure and English caption ↗
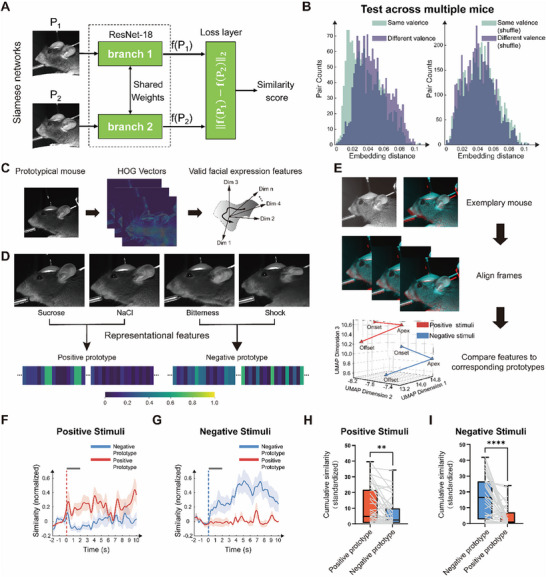
Similar responses can be found across mice
Individual faces differ. A paired-image network is trained with same-valence pairs from different mice and different-valence pairs within mice, encouraging attention to shared response-associated features.
In five mice excluded from training, same-valence images remain closer in the network. Positive and negative edge-feature prototypes also allow framewise comparison, describing facial dynamics over time rather than selecting only one conspicuous image.
Source: Chen Y et al. · Advanced science (Weinheim, Baden-Wurttemberg, Germany) · CC BY
Original figure and English caption ↗
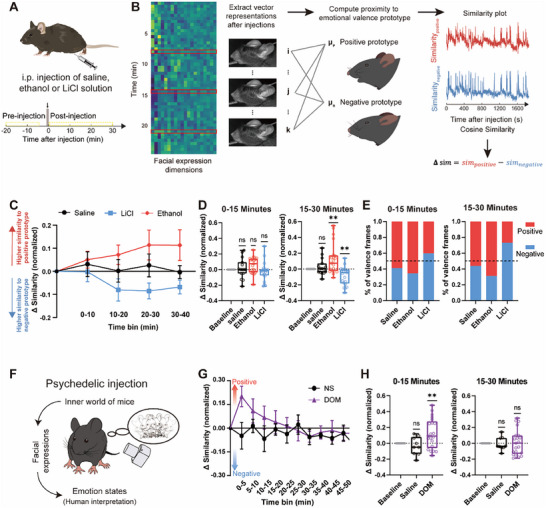
Prototype similarity captures short-term shifts
Following treatment, ethanol-group images become more similar to positive prototypes, lithium-chloride images to negative prototypes, and saline images change less. Some differences become clearer after fifteen minutes, revealing temporal shifts in facial features.
DOM produces a more transient shift toward the positive prototype in the first fifteen minutes, followed by a return. These are facial changes relative to stimulus-defined prototypes, providing a continuous scale for tracking short-term response dynamics.
Source: Chen Y et al. · Advanced science (Weinheim, Baden-Wurttemberg, Germany) · CC BY
Original figure and English caption ↗
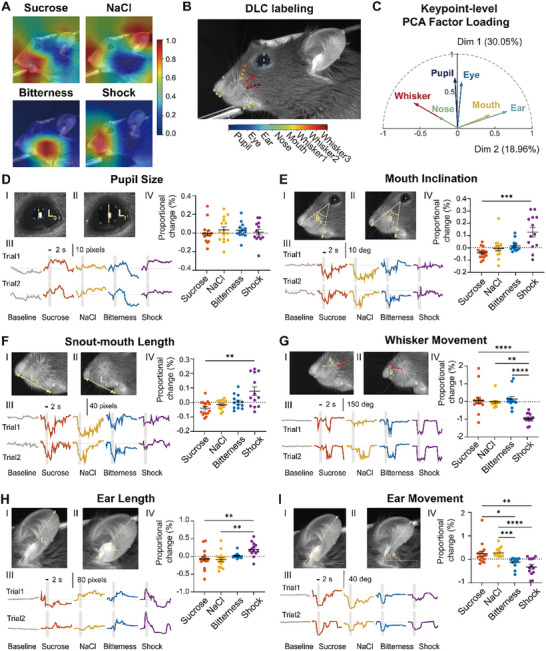
Ears, mouth and whiskers contribute differently
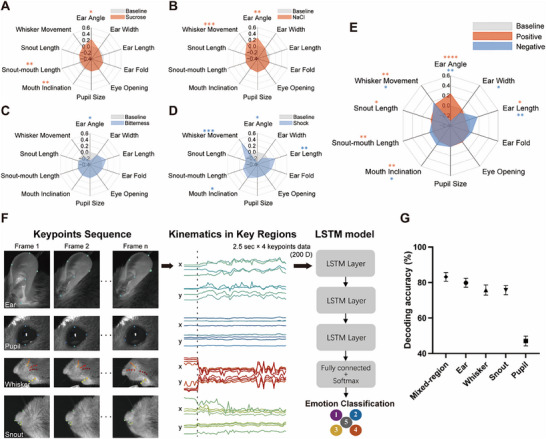
Thirty-seven facial keypoints quantify ear angle and length, mouth inclination, snout–mouth distance and whisker movements. Features show coordinated changes within valence groups, with ear-angle and mouth-inclination trends differing across positive and negative stimuli.
Pupils respond to stimuli without significant between-condition differences; ear dynamics distinguish conditions more prominently. Whisker responses are faster and pupil changes later. Local features differ in both magnitude and time course.
Source: Chen Y et al. · Advanced science (Weinheim, Baden-Wurttemberg, Germany) · CC BY
Original figure and English caption ↗
Ear dynamics alone retain substantial classification information
A temporal model achieves about eighty percent classification accuracy using ear trajectories alone, close to about eighty-three percent for mixed-region inputs. Ear occlusion also causes the largest accuracy drop in a separate image-model test.
The researchers also compare trials with more running. Even when overall movement is similar, ear postures differ across valence conditions. Local ear changes retain information distinguishing these responses against comparable overall movement.
Source: Chen Y et al. · Advanced science (Weinheim, Baden-Wurttemberg, Germany) · CC BY
Original figure and English caption ↗
VTA populations respond differently across stimuli
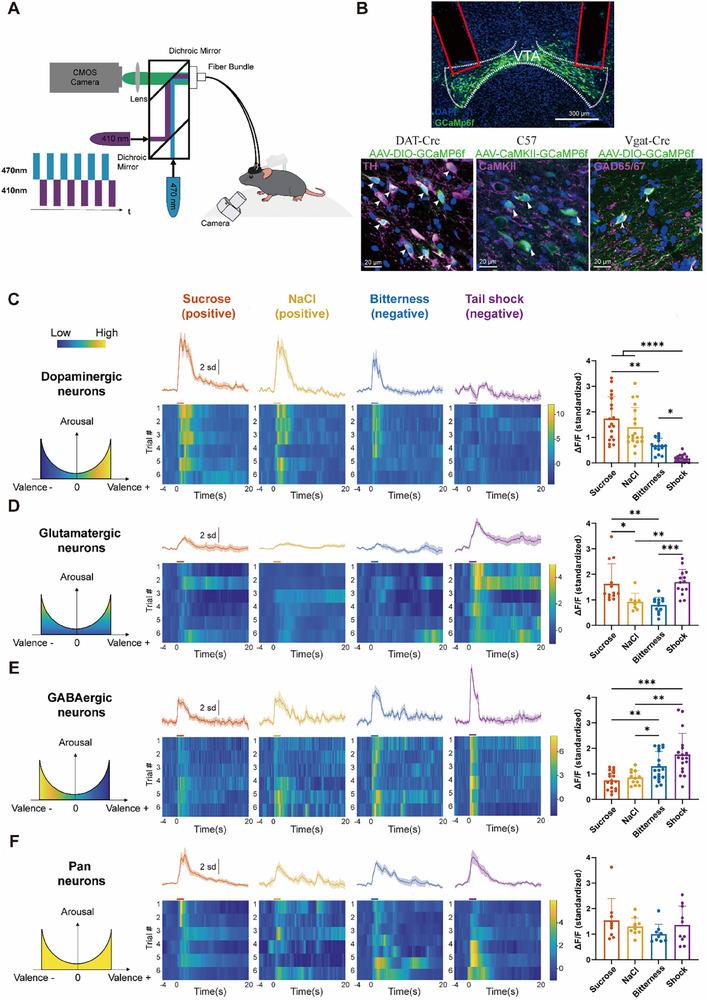
Synchronized recordings show stronger dopamine-population responses to sucrose and salt solution, and stronger GABA responses to bitterness and shock. Glutamate-associated populations respond more prominently to sucrose and shock. Cell-type separation reveals differences absent in aggregate recordings.
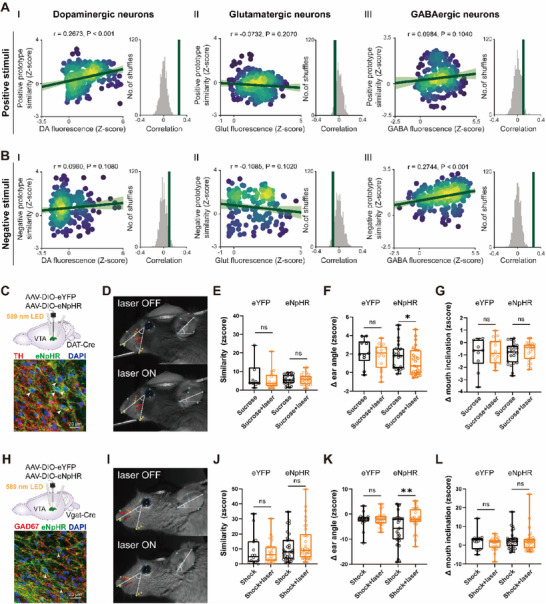
Dopamine signals correlate with positive-prototype similarity during sucrose, and GABA signals with negative similarity during shock. Glutamate-associated populations show no significant corresponding relationship, revealing cell-type-dependent associations.
Source: Chen Y et al. · Advanced science (Weinheim, Baden-Wurttemberg, Germany) · CC BY
Original figure and English caption ↗
VTA modulation produces prominent ear-angle changes
Optical dopamine-cell inhibition reduces ear-angle changes during positive stimuli; GABA inhibition changes ear posture during negative stimuli. Overall similarity and mouth inclination remain nonsignificantly changed, as do expressions without stimulation.
Ear prominence extends from image analysis to neural modulation. In head-fixed males under defined stimulus conditions, a subtle movement links facial features with brain activity. Its location and time course make the response more specifically interpretable.
Source: Chen Y et al. · Advanced science (Weinheim, Baden-Wurttemberg, Germany) · CC BY
Original figure and English caption ↗