Does more firing mean more spatial information in the hippocampus?
Two hippocampal populations fire differently on the same route. In mice, one place-cell population carries more spatial information per spike, while waking and sleep reveal distinct timing patterns.
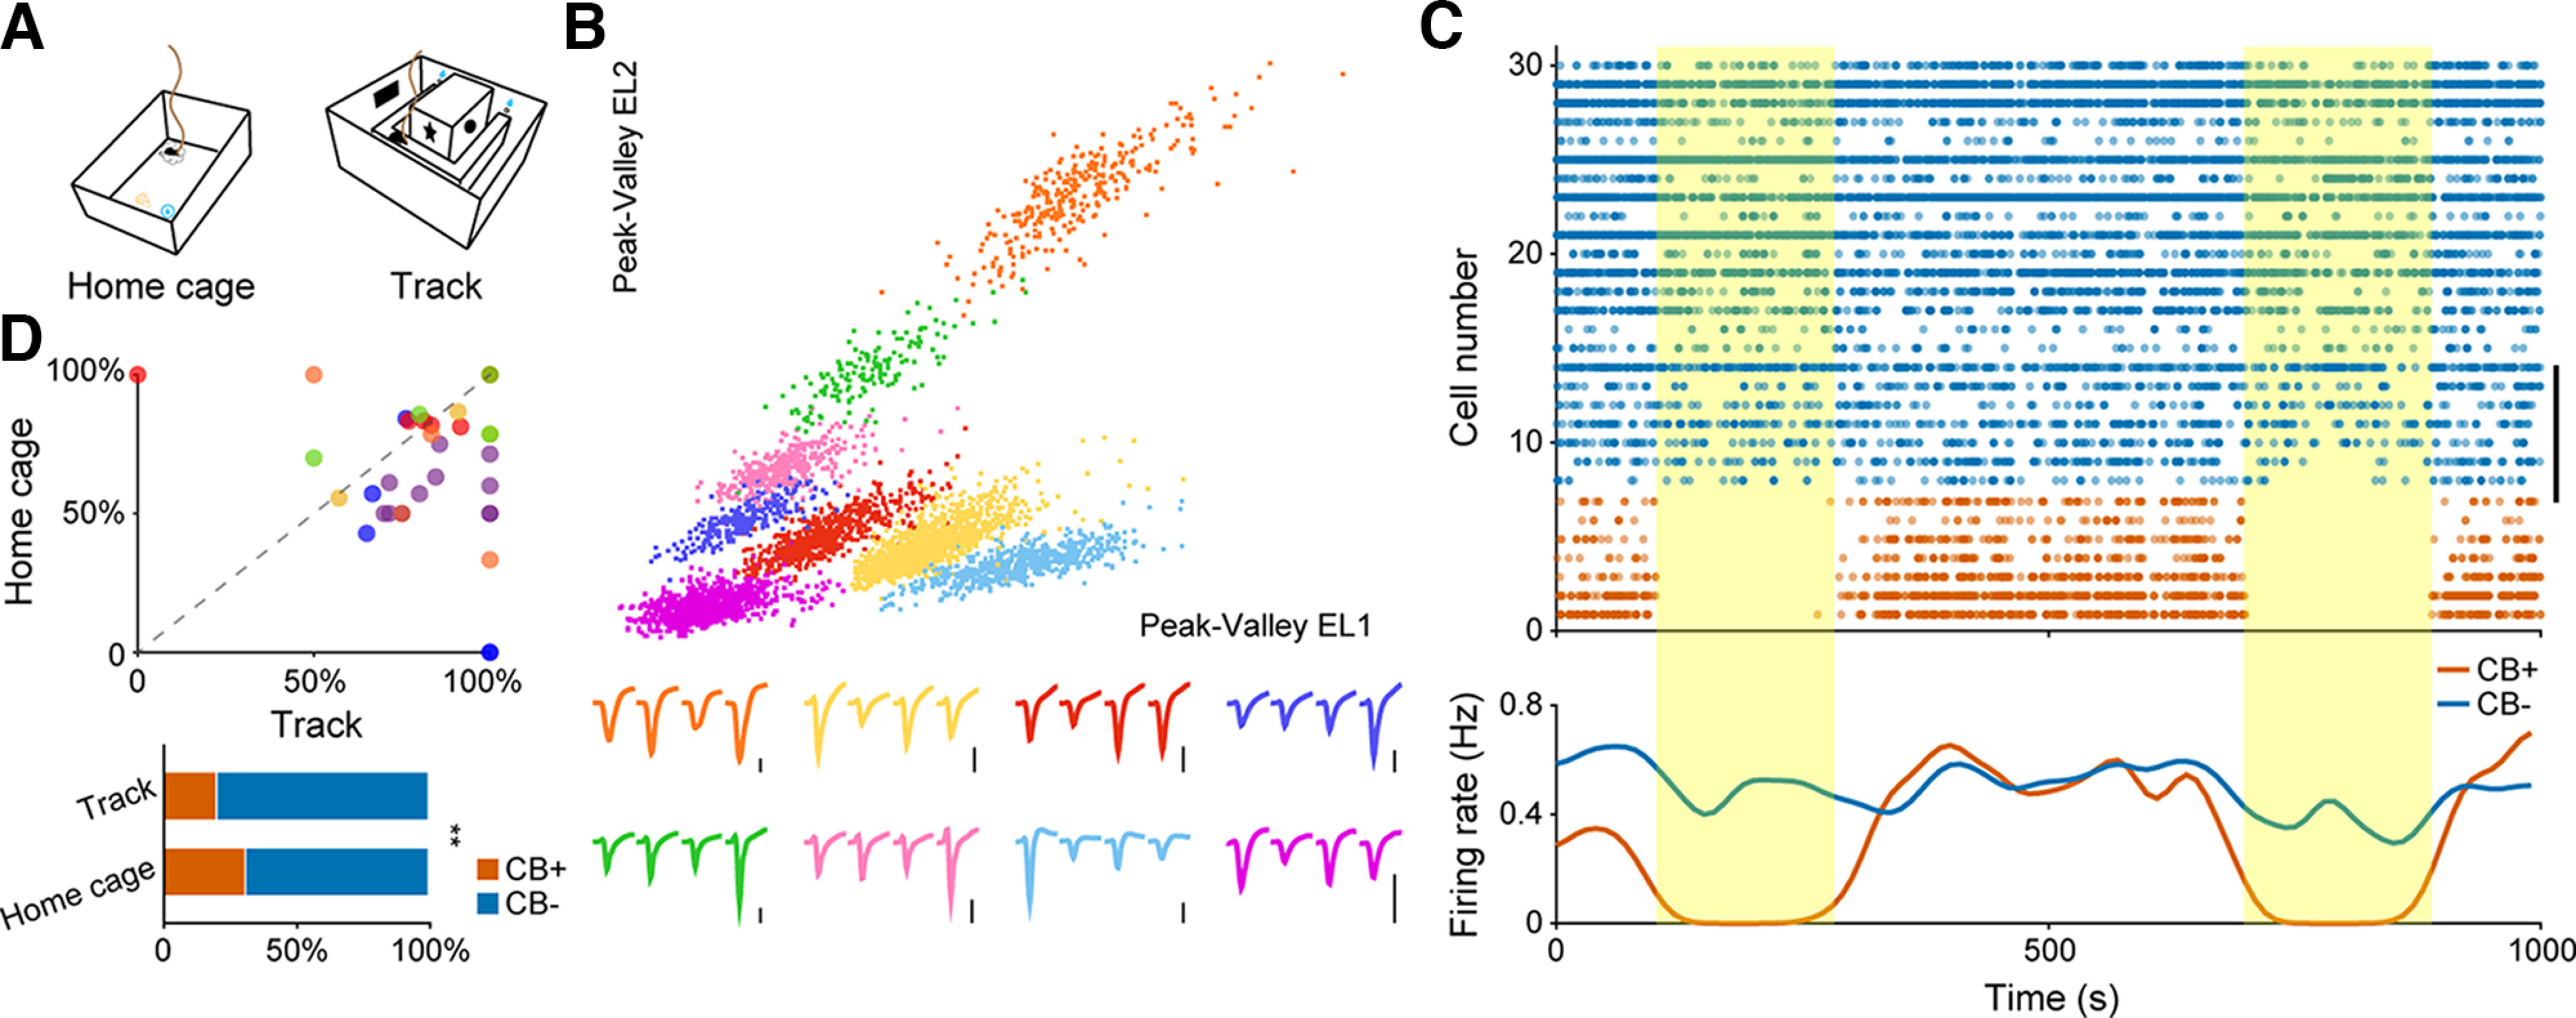
As mice shuttle along a track, hippocampal place cells become more active at particular locations. Does a population that fires more necessarily describe position more precisely? A study published in eNeuro on March 14, 2023 compared CA1 pyramidal populations classified by expression of the calcium-binding protein Calbindin. Average activity and information per spike did not tell the same story. During sleep, distinct relationships with neural rhythms added another dimension beyond which population was more active.
Calbindin-positive place cells carry more spatial information per spike without a significant increase per second. Differences in REM theta modulation and in slow-wave-sleep ripple timing and participation further demonstrate heterogeneity within hippocampal pyramidal populations.
Contents · 7 sections
Pyramidal cells need not share one activity profile
The study compared Calbindin-positive and negative CA1 pyramidal neurons, termed CB-positive and CB-negative. Mice rested in a familiar environment and shuttled on a U-shaped track. Spikes, behavior and local field potentials distinguished running, slow-wave sleep and REM sleep.
Calbindin primarily served as a population marker. Marker-related responses helped classify cells for subsequent comparisons, without demonstrating that changing the protein itself alters spatial memory. Cellular location and afferent connections may also contribute to population differences.
Source: Gu L et al. · eNeuro · CC BY
Original figure and English caption ↗
Lower firing during running, similar averages during sleep
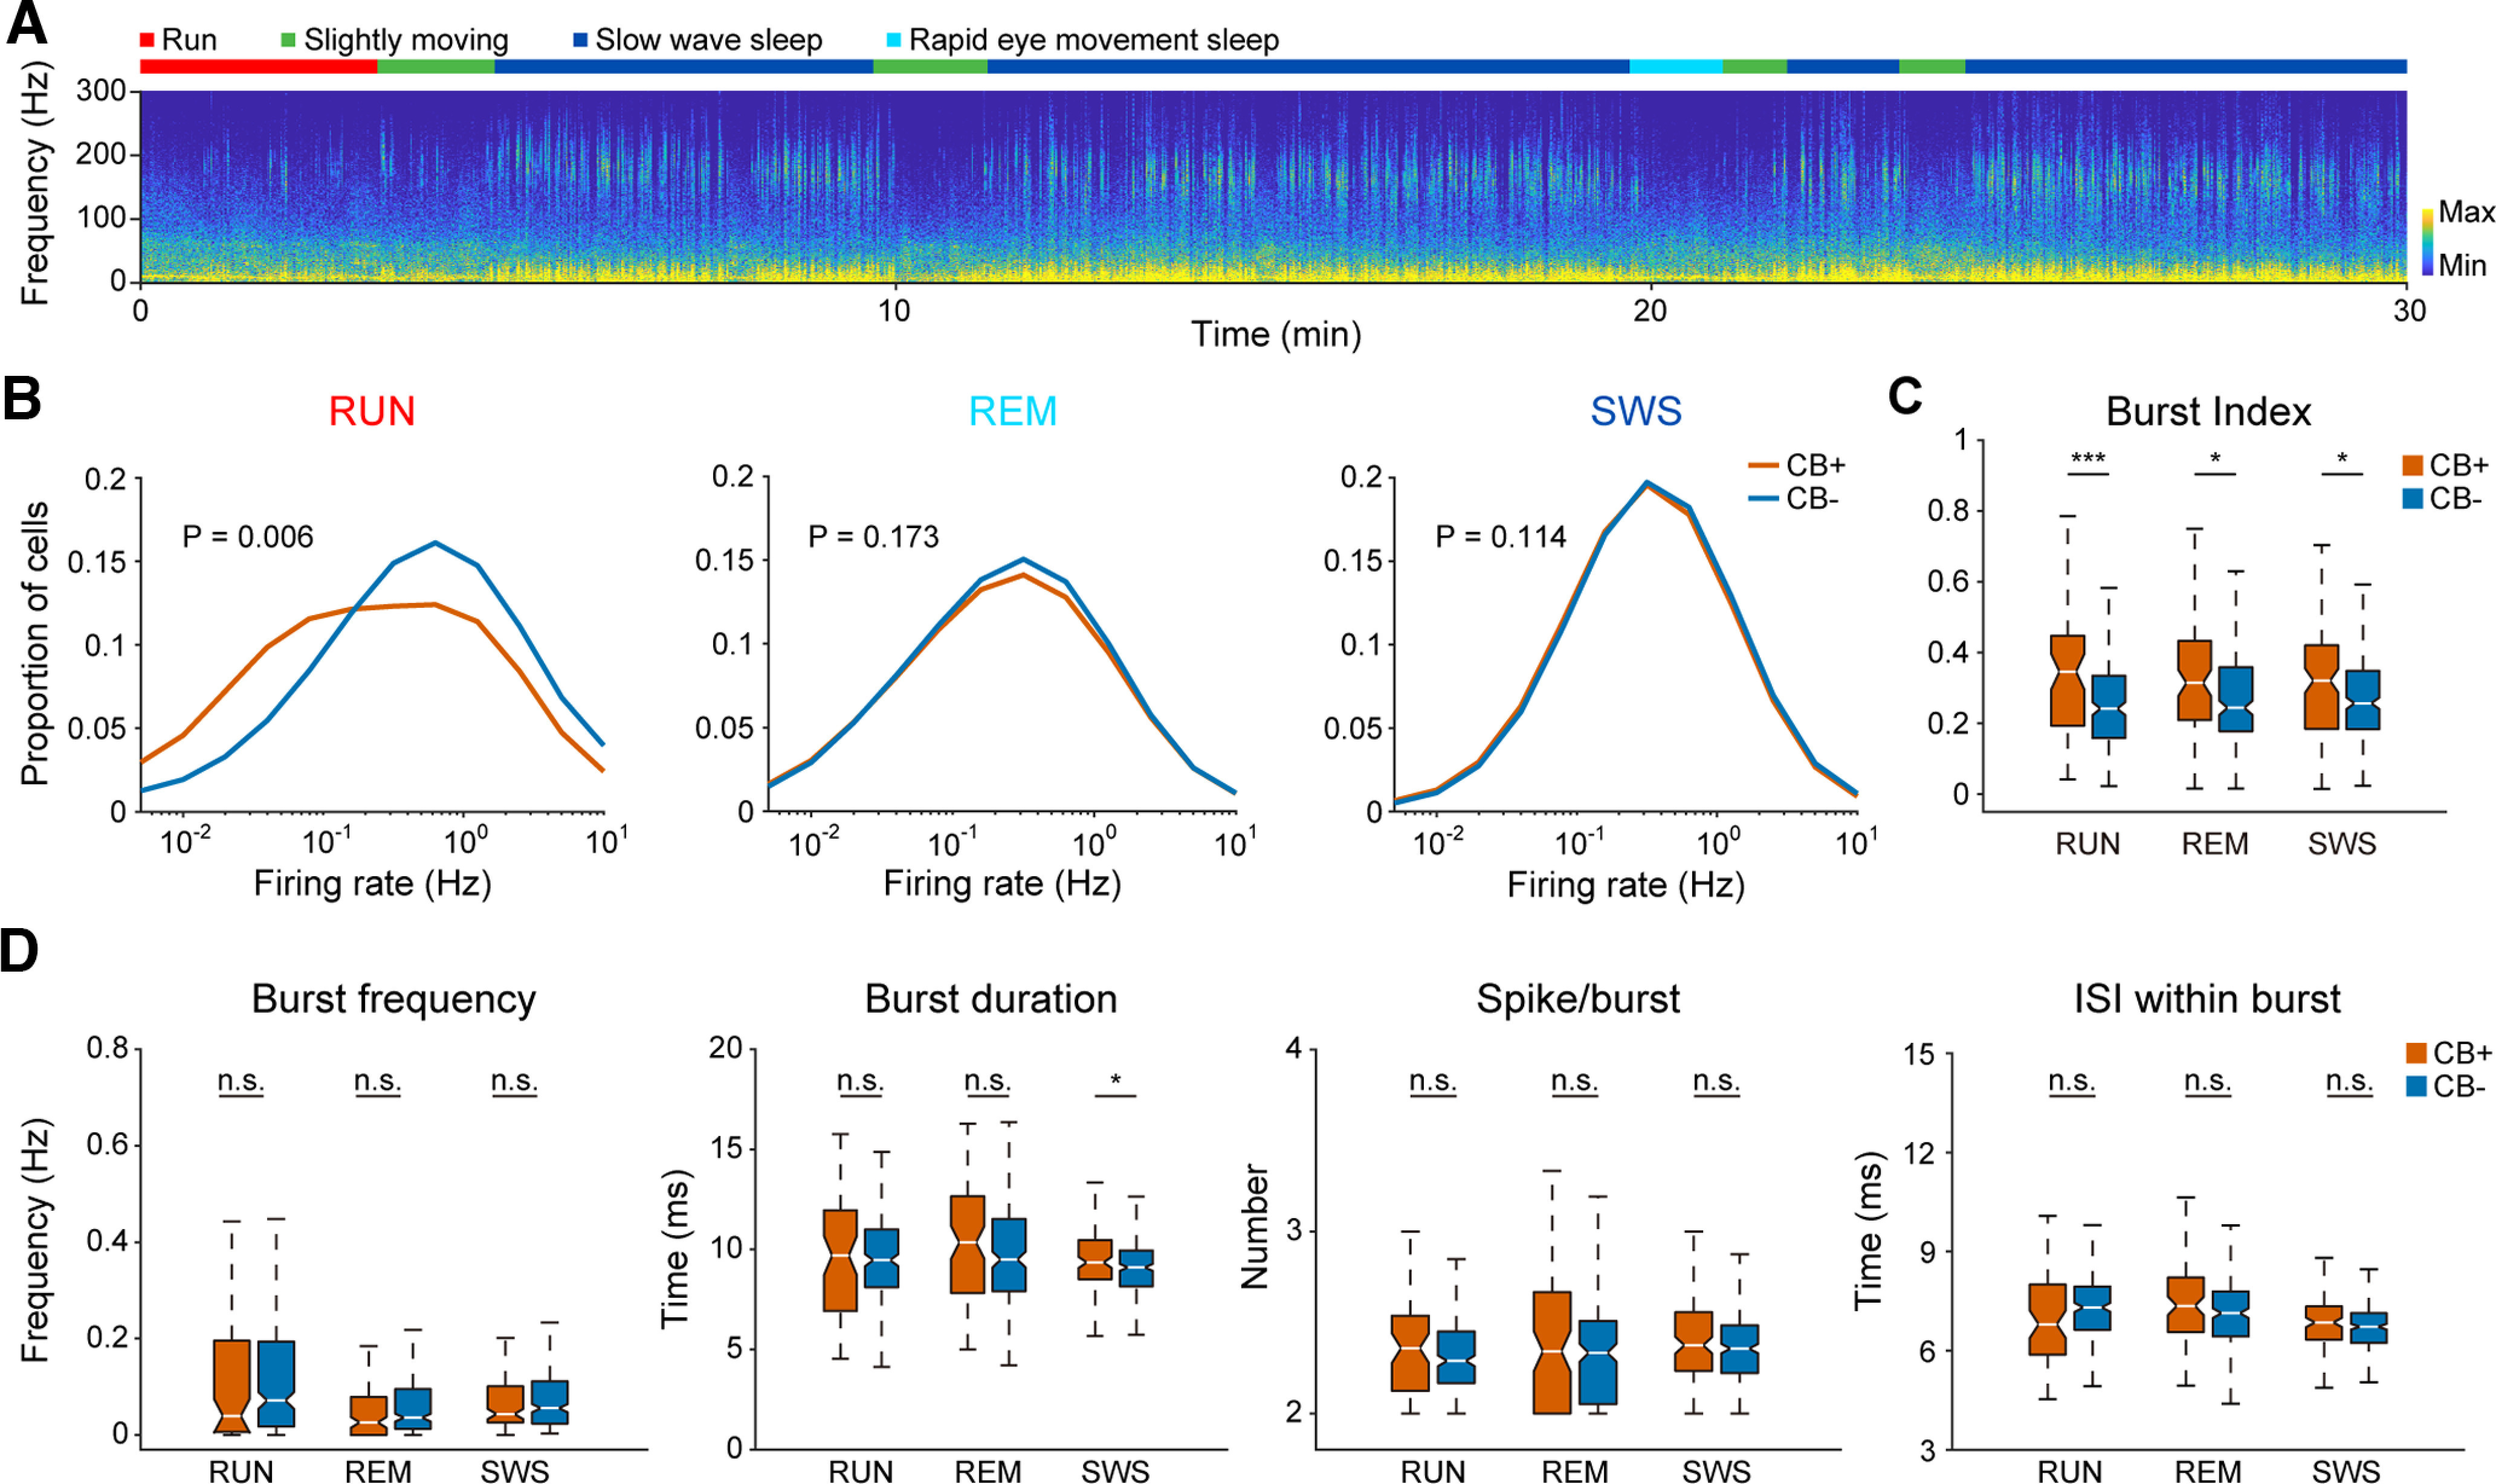
CB-negative neurons fired faster on average during running, whereas mean-rate differences were not significant during REM or slow-wave sleep. CB-positive cells had a higher burst index across all three states, distinguishing firing organization from overall rate.
Most detailed burst measures, including burst frequency, spikes per burst and within-burst intervals, were not significantly different. A burst-duration difference appeared during slow-wave sleep, so a higher index did not mean uniform enhancement of all firing features.
Source: Gu L et al. · eNeuro · CC BY
Original figure and English caption ↗
Information per spike adds more than spike counts alone
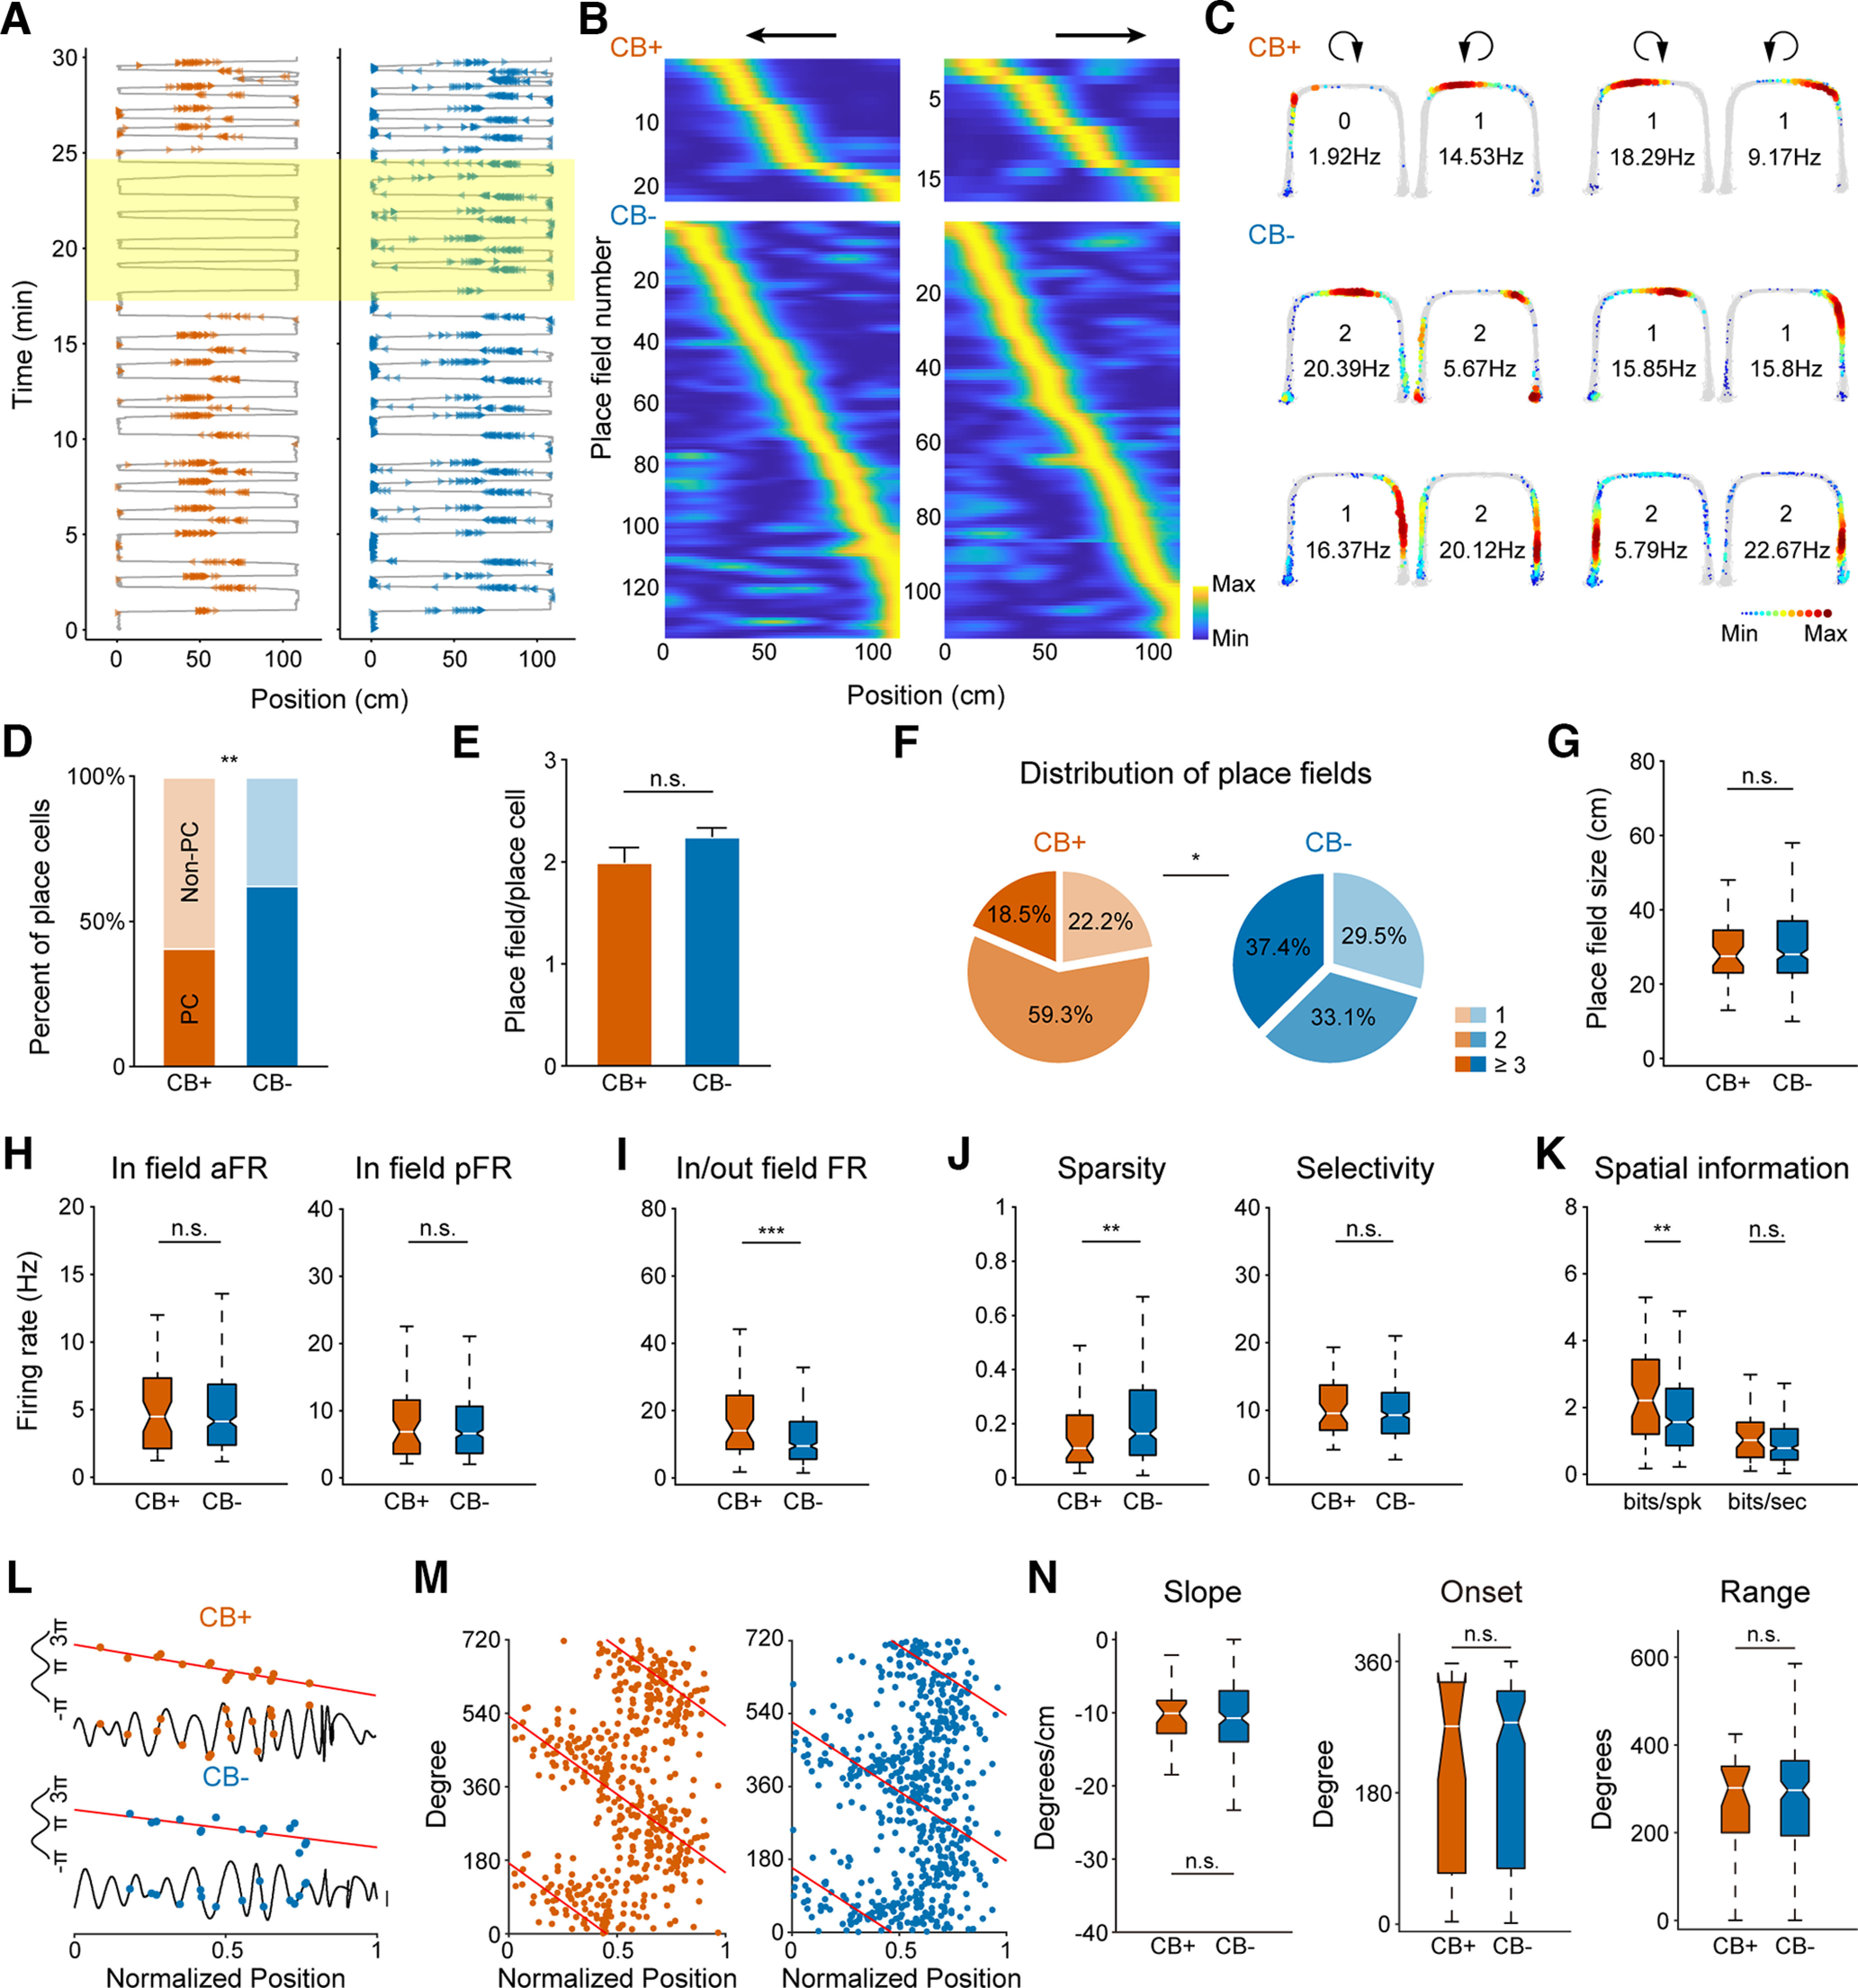
Both populations included place cells, but the proportion was lower among CB-positive neurons, approximately 41% versus 63%. Among identified place cells, average field number, field size and within-field average and peak firing rates did not significantly differ.
Place-cell activity in both populations covered the track, with direction-dependent responses. CB-positive place cells more often formed two fields, typically one in each direction. This distributional difference can coexist with a nonsignificant difference in average field count.
The clearer distinction was the inside/outside-field firing contrast. CB-positive place-cell responses were more concentrated and carried more spatial information per spike. Information per second and phase-precession measures did not significantly differ, locating the efficiency advantage specifically at the per-spike level.
Source: Gu L et al. · eNeuro · CC BY
Original figure and English caption ↗
A subset shifts its preferred timing during REM
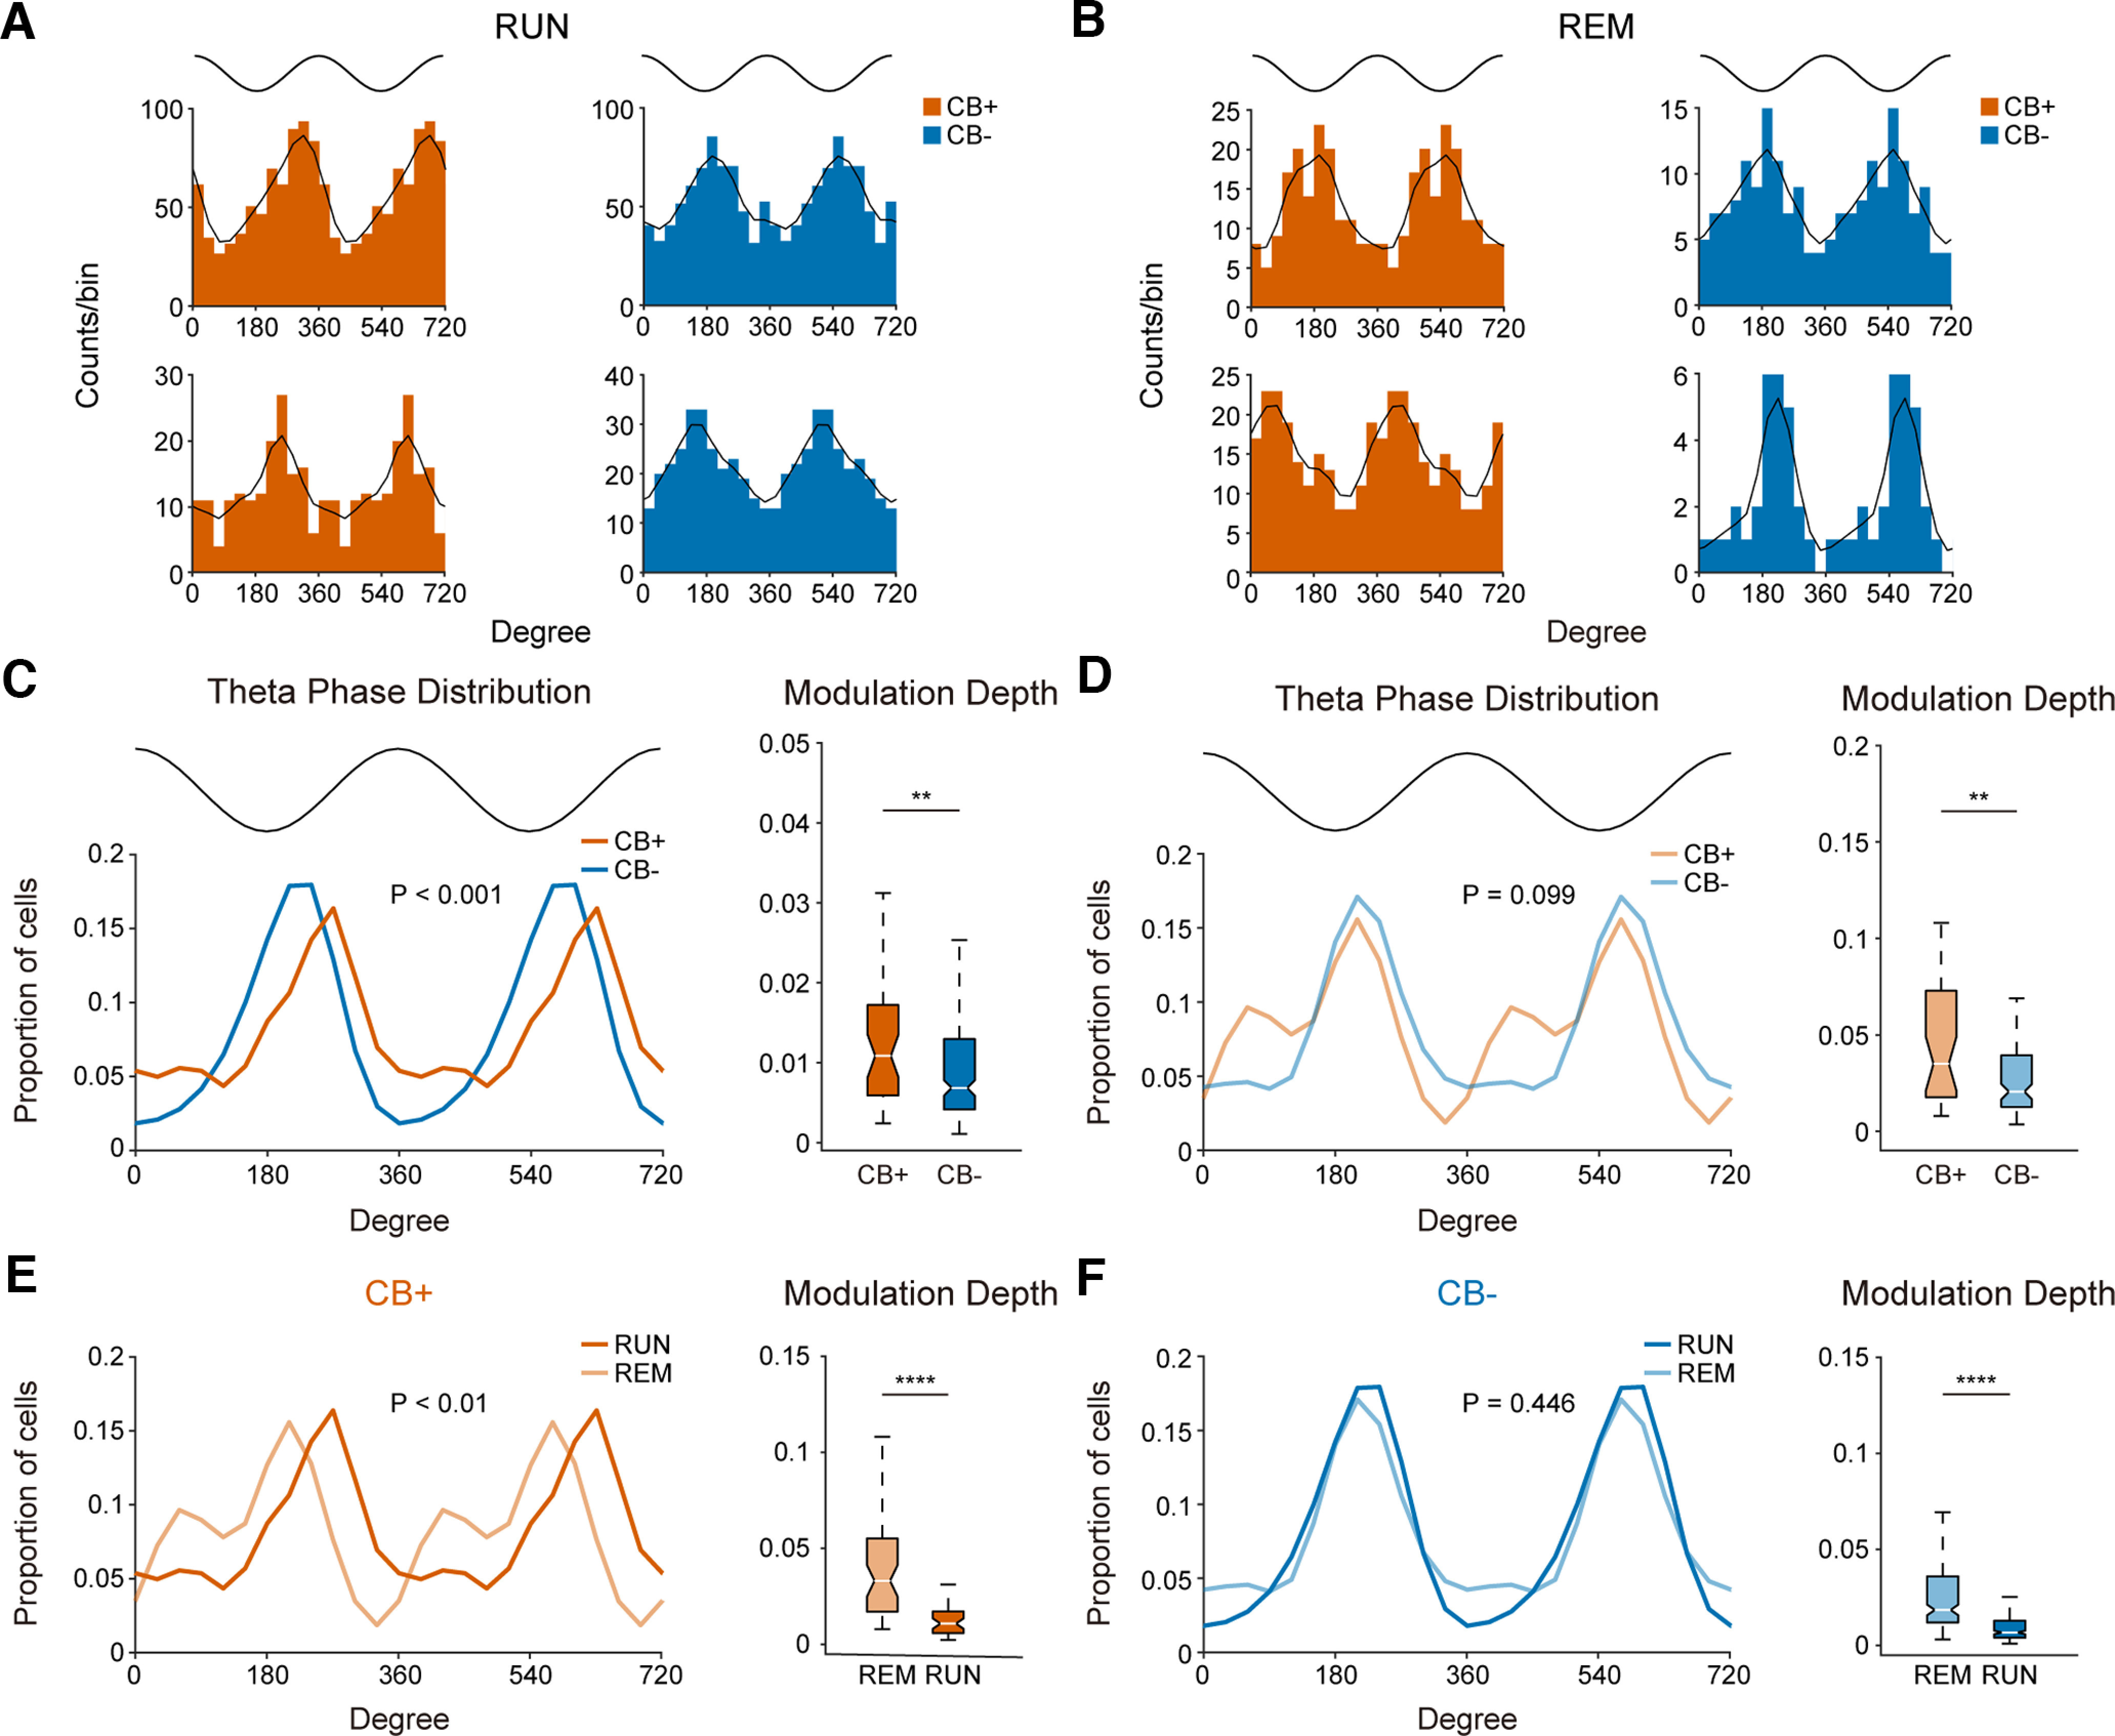
Theta rhythms occur during both running and REM, and cells favor particular phases for firing. A subset of CB-positive neurons shifted preferred timing during REM, while the CB-negative phase distribution did not significantly shift between running and REM.
Preferred-phase distributions did not differ significantly between populations during REM, but CB-positive neurons showed stronger phase locking. Both populations were more strongly theta-modulated during REM than running. Preferred phase and strength of phase locking are different properties. These timing findings do not directly reveal dream content or establish memory consolidation.
Source: Gu L et al. · eNeuro · CC BY
Original figure and English caption ↗
Greater participation and earlier timing are distinct
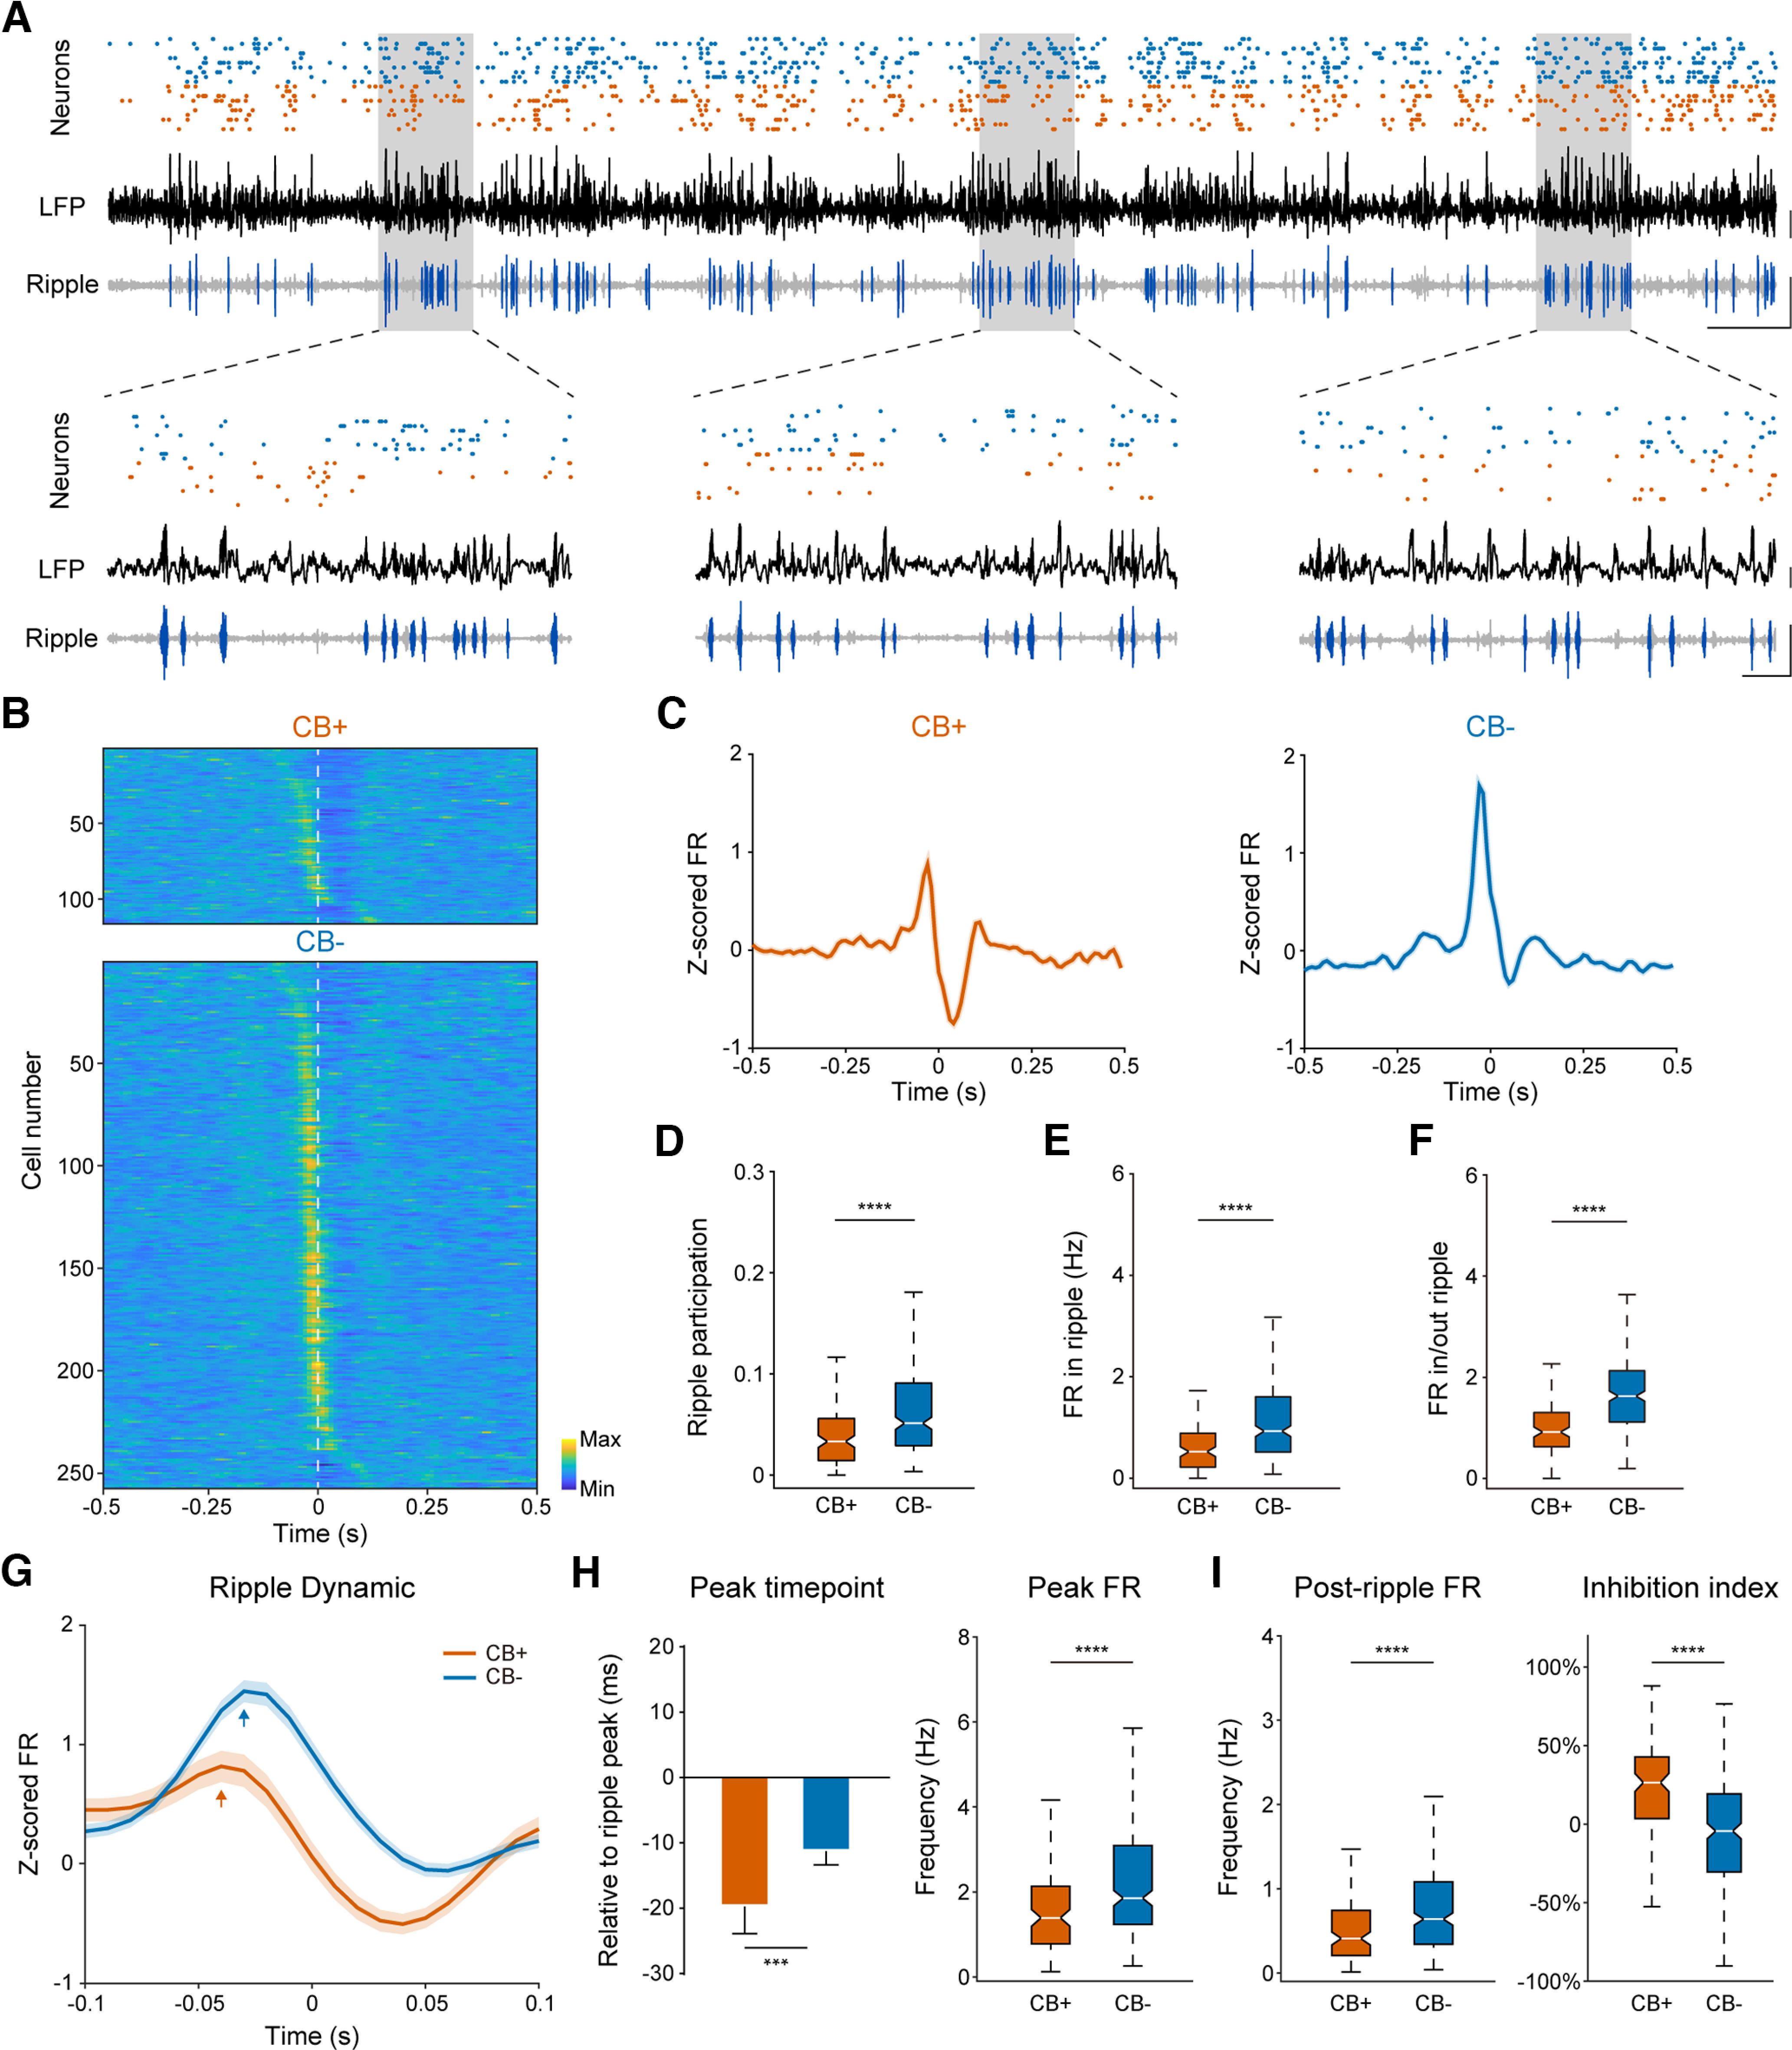
During slow-wave-sleep ripples, CB-negative neurons participated more often, fired more within events and had a higher inside/outside-event rate ratio. CB-positive activity peaked earlier and showed stronger suppression after the ripple peak, revealing event-level differences despite similar overall sleep firing rates.
Source: Gu L et al. · eNeuro · CC BY
Original figure and English caption ↗
The less active population can show tighter locking
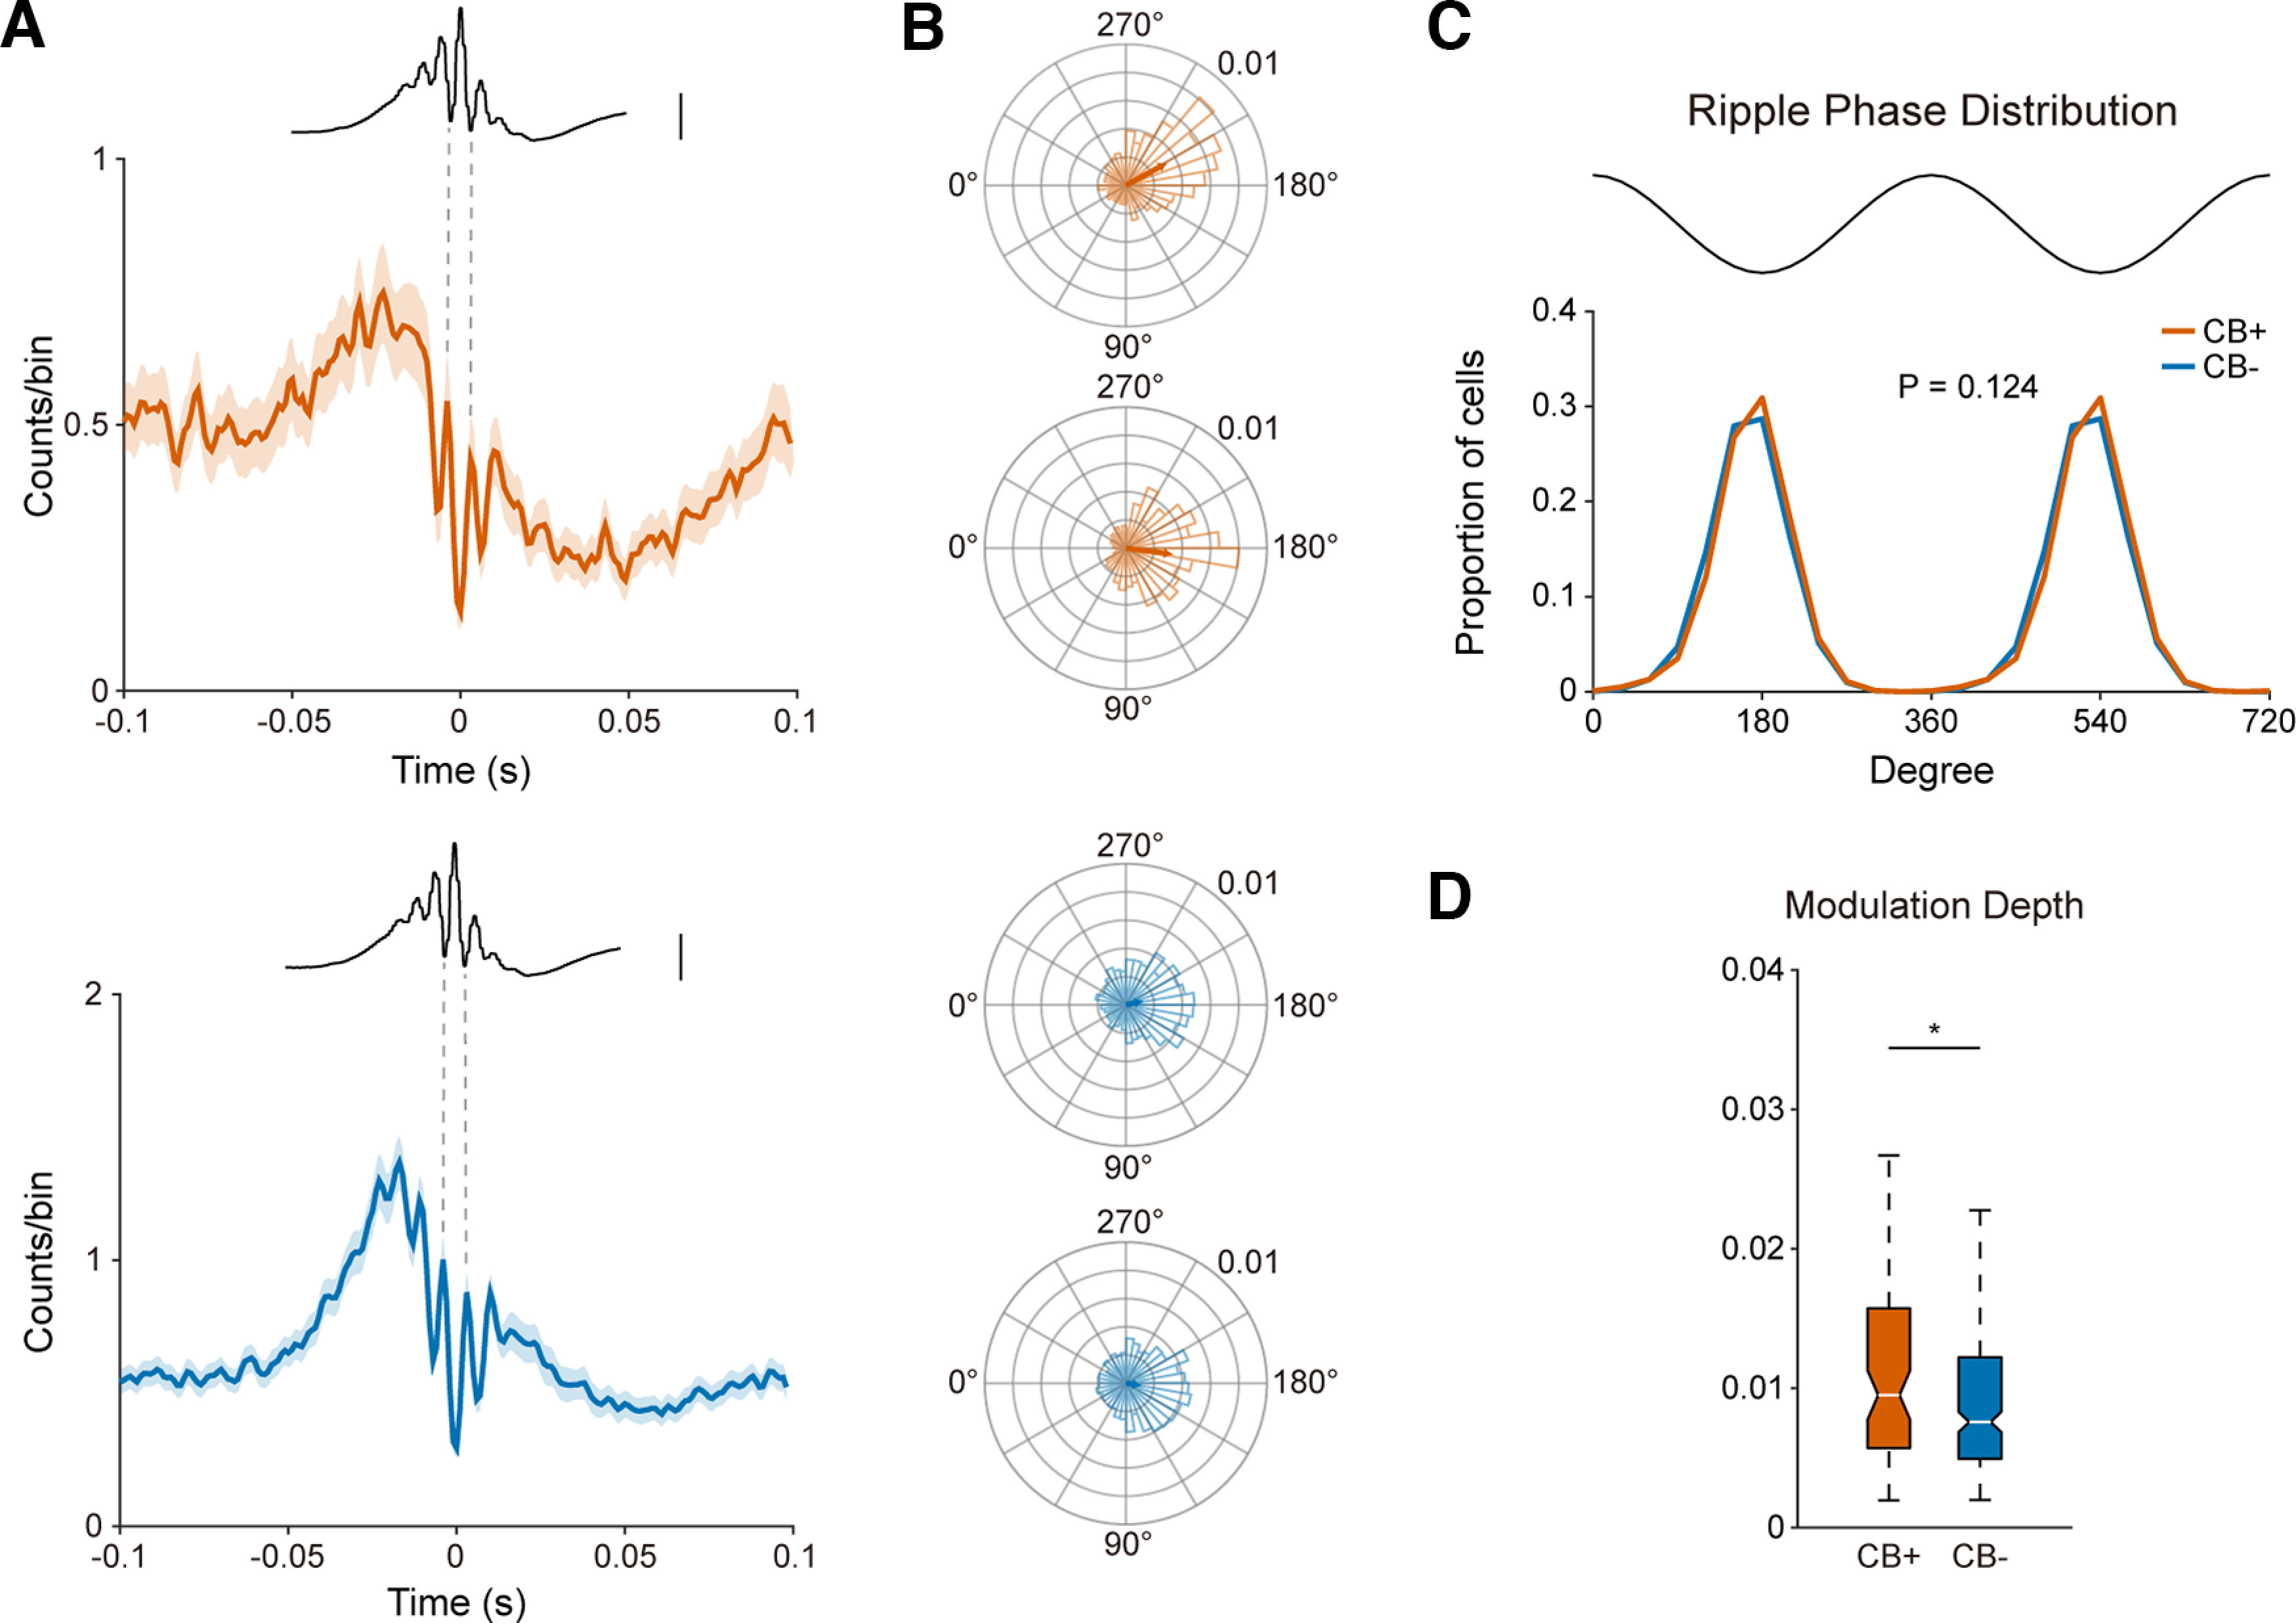
Both populations favored firing near ripple troughs without a significant difference in preferred-phase distributions, but CB-positive neurons showed stronger phase locking. Participation, rate, timing and precision therefore reveal more than activity strength alone.
Source: Gu L et al. · eNeuro · CC BY
Original figure and English caption ↗
A hippocampal map can involve distinct cellular contributions
This study in adult male mice highlights diversity within CA1 pyramidal populations. Differences in afferent inputs remain candidate explanations rather than directly established mechanisms, and some classification errors remain possible. How spatial coding and sleep rhythms jointly support memory requires further functional evidence beyond recorded associations.