Why does breathing stop after a seizure? A protocol for tracing the dorsal raphe-to-brainstem respiratory circuit
In DBA/1 mouse models of seizure-induced respiratory arrest, this protocol combines retrograde tracing, optogenetics, and bilateral fiber photometry along the dorsal raphe–pre-Bötzinger pathway.
On February 20, 2023, HongHai Zhang and colleagues (with co-first authors YuLing Wang, Qing Xu, Qian Yu, and LeYuan Gu, alongside HaiXiang Ma and team) at Zhejiang Chinese Medical University, Affiliated Hangzhou First People's Hospital of Zhejiang University School of Medicine, and Westlake Laboratory of Life Sciences and Biomedicine published a protocol paper titled "Protocol for modulation of the serotonergic DR-PBC neural circuit to prevent SUDEP in the acoustic and PTZ-induced DBA/1 mouse models of SUDEP" in STAR Protocols. Serving as the companion methodological guide to their primary research article in iScience (Ma et al., 2022), this protocol addresses seizure-induced respiratory arrest (S-IRA)—the primary proximate cause of sudden unexpected death in epilepsy (SUDEP)—by detailing stereotaxic viral delivery, intracerebroventricular and bilateral nuclear cannulation, retrograde circuit tracing, optogenetic stimulation, and dual-wavelength fiber photometry in acoustic and pentylenetetrazole (PTZ)-induced DBA/1 mouse models.
The protocol establishes standardized stereotaxic procedures targeting the dorsal raphe nucleus (DR, using a 10° right-angled trajectory to avoid overlying vasculature) and the bilateral pre-Bötzinger complex (PBC), integrating CTB-555 retrograde tracing, serotonergic ChETA optogenetics, localized ketanserin (KET) microinjection, and bilateral PBC GCaMP6f calcium photometry to demonstrate how DR-to-PBC serotonergic transmission suppresses S-IRA via PBC 5-HT2A receptors.
Contents · 5 sections
Dual-Modality DBA/1 Mouse SUDEP Models and Retrograde Circuit Tracing Design
Seizure-induced respiratory arrest (S-IRA) is the primary pathophysiological event underlying sudden unexpected death in epilepsy (SUDEP). Building on prior evidence that enhancing serotonergic (5-HT) function in the dorsal raphe nucleus (DR) lowers S-IRA incidence in DBA/1 mice and that the pre-Bötzinger complex (PBC) within the ventral respiratory column governs respiratory rhythmogenesis, the authors standardize two complementary DBA/1 mouse models: an acoustic stimulation model in which mice are primed daily at postnatal days 26–28 with a 96 dB SPL bell for 3–4 days and tested at 8 weeks of age for generalized audiogenic seizures (AGSz) and S-IRA, and a pentylenetetrazole (PTZ) model in which non-primed 8-week-old mice receive intraperitoneal PTZ (75 mg/kg).
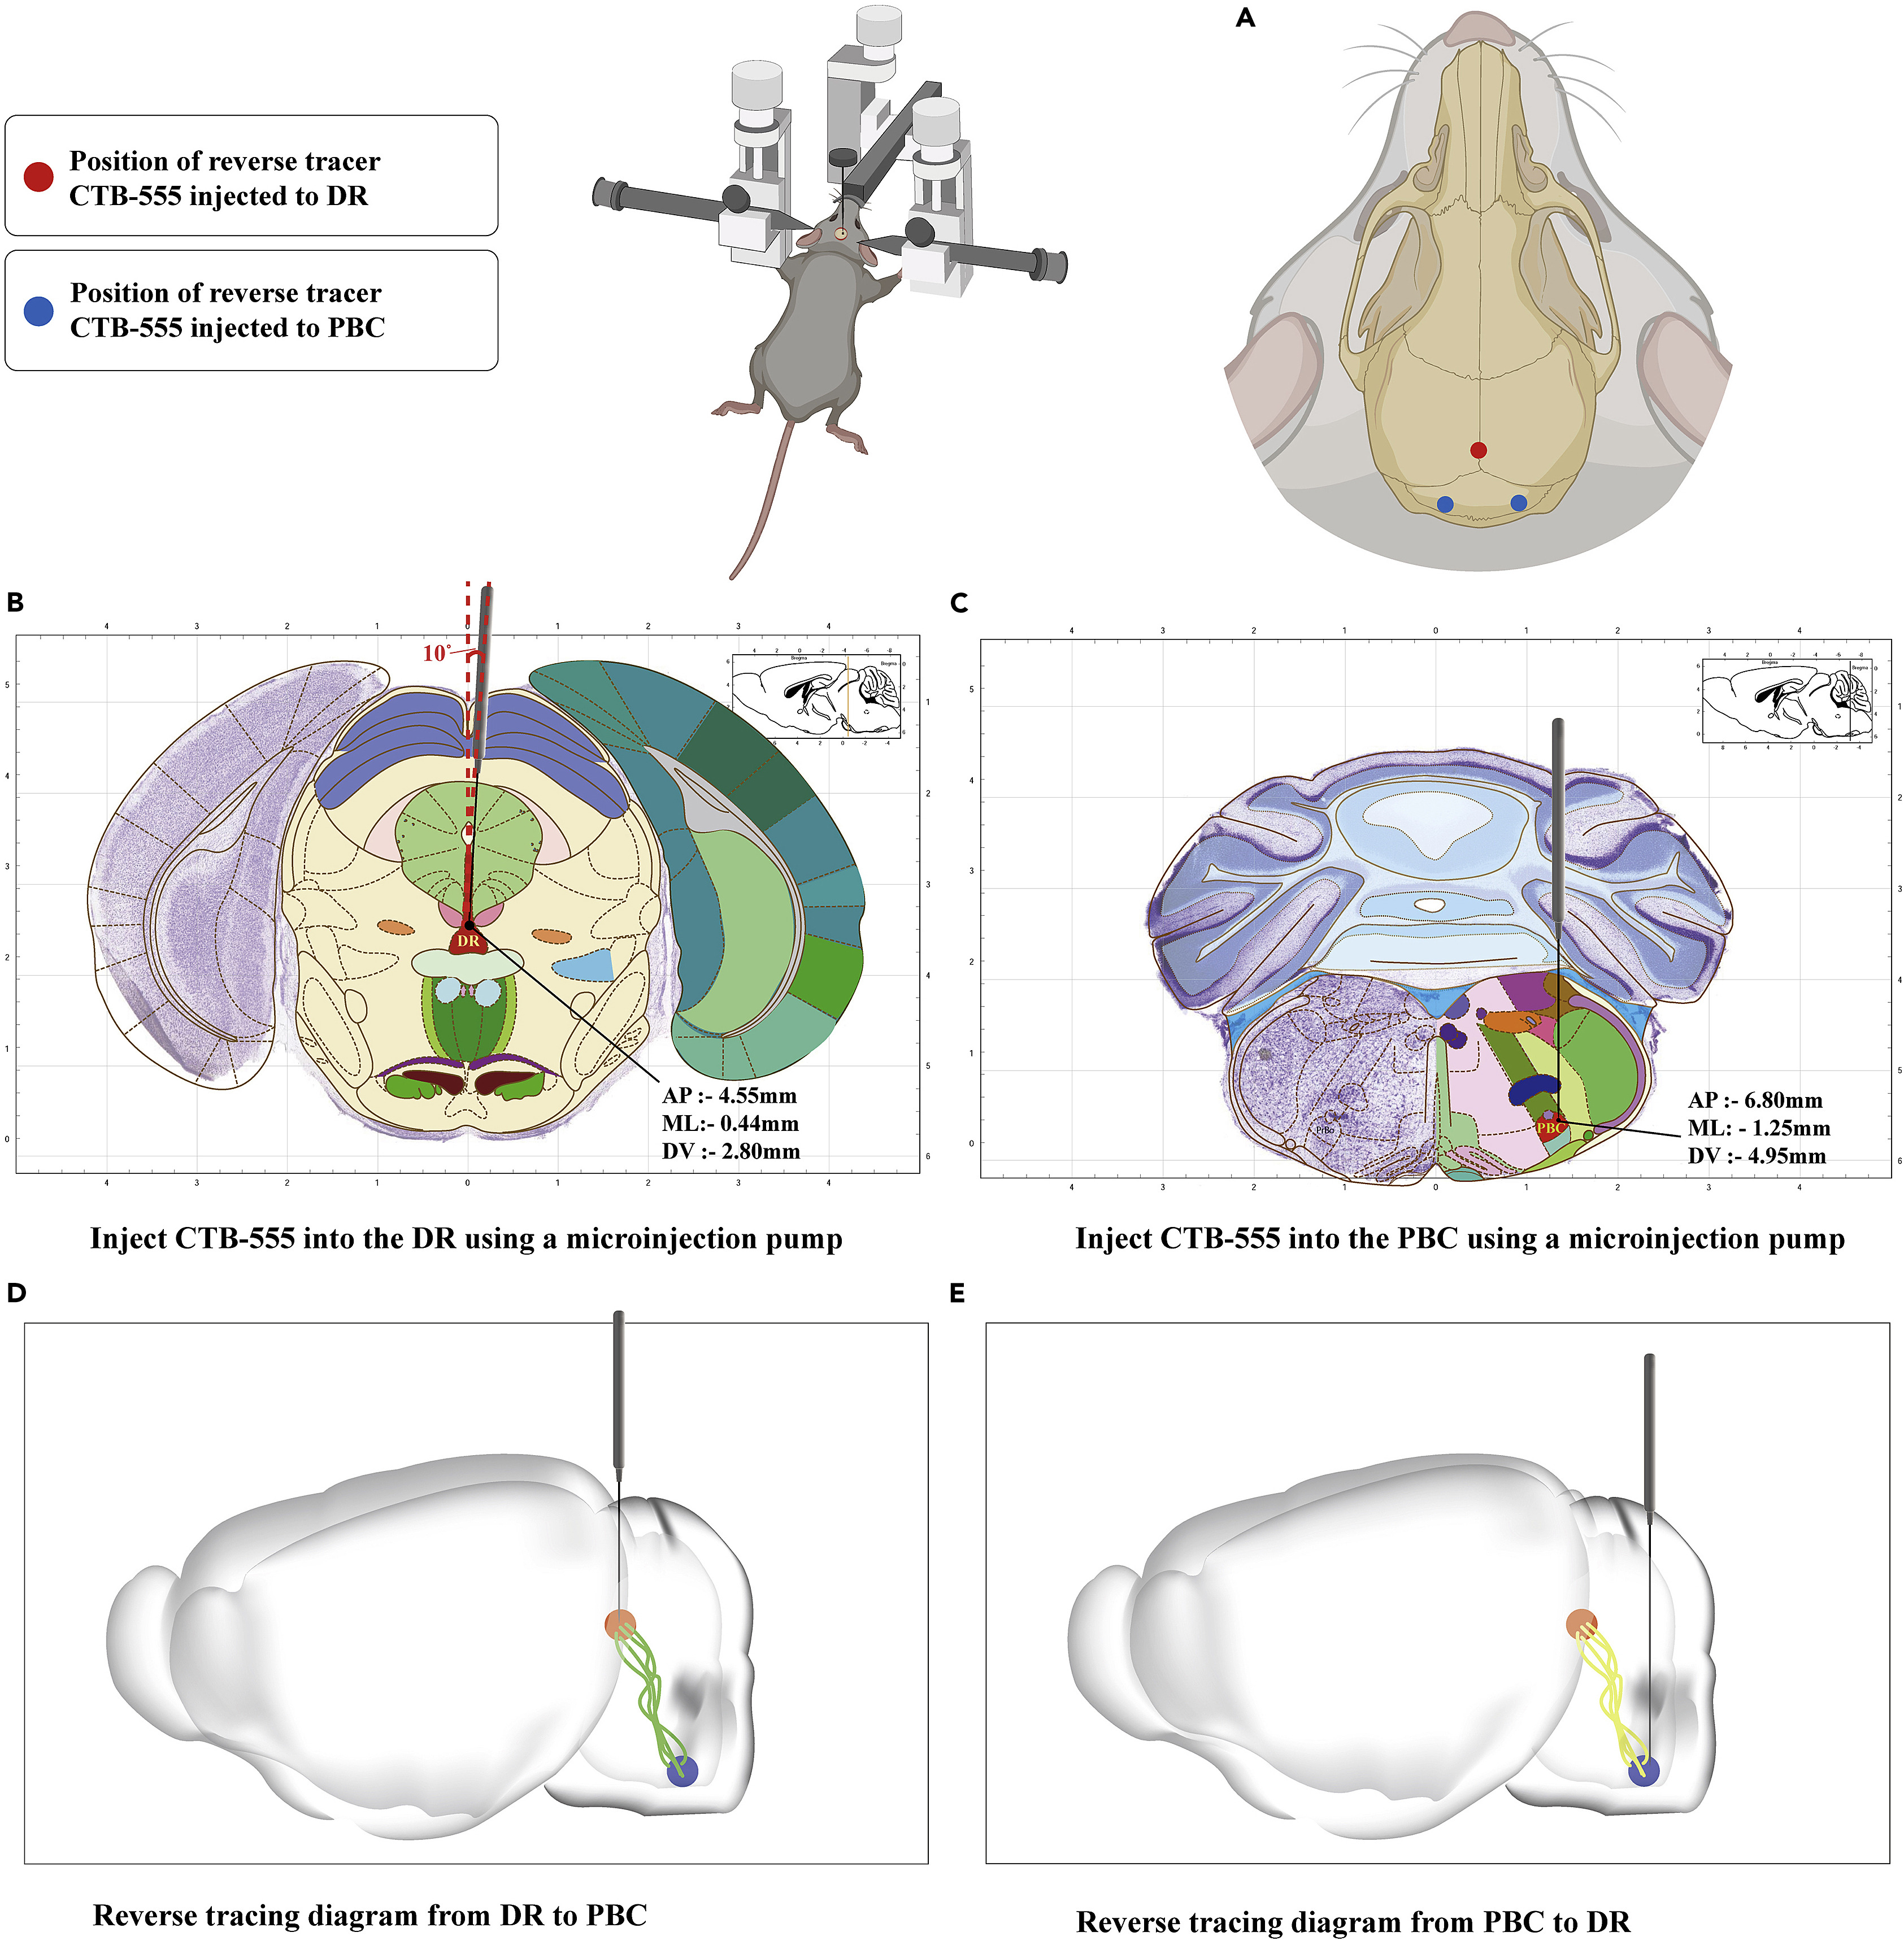
Because DBA/1 mice are highly sensitive to ambient noise and temperature fluctuations—with lower temperatures reducing S-IRA susceptibility—the protocol specifies strict soundproofing and thermal insulation (maintaining room temperature at 25–26 °C) during housing, transport, and testing. To establish the anatomical connectivity between the DR and PBC, the retrograde tracer CTB-555 is microinjected into either the DR (AP −4.55 mm, ML −0.44 mm, DV −2.80 mm, 10° right tilt) or the bilateral PBC (AP −6.80 mm, ML −1.25 mm, DV −4.95 mm), enabling histological verification of reciprocal DR–PBC projections after one week of transport.
Source: Wang Y et al. · STAR protocols · © 2023 The Author(s)This is an open access article under the CC BY-NC-ND license (http://creativecommons.org/licenses/by-nc-nd/4.0/).
Original figure and English caption ↗
Angled Dorsal Raphe Optical Fiber Implantation and Intracerebroventricular Cannulation with EEG Monitoring
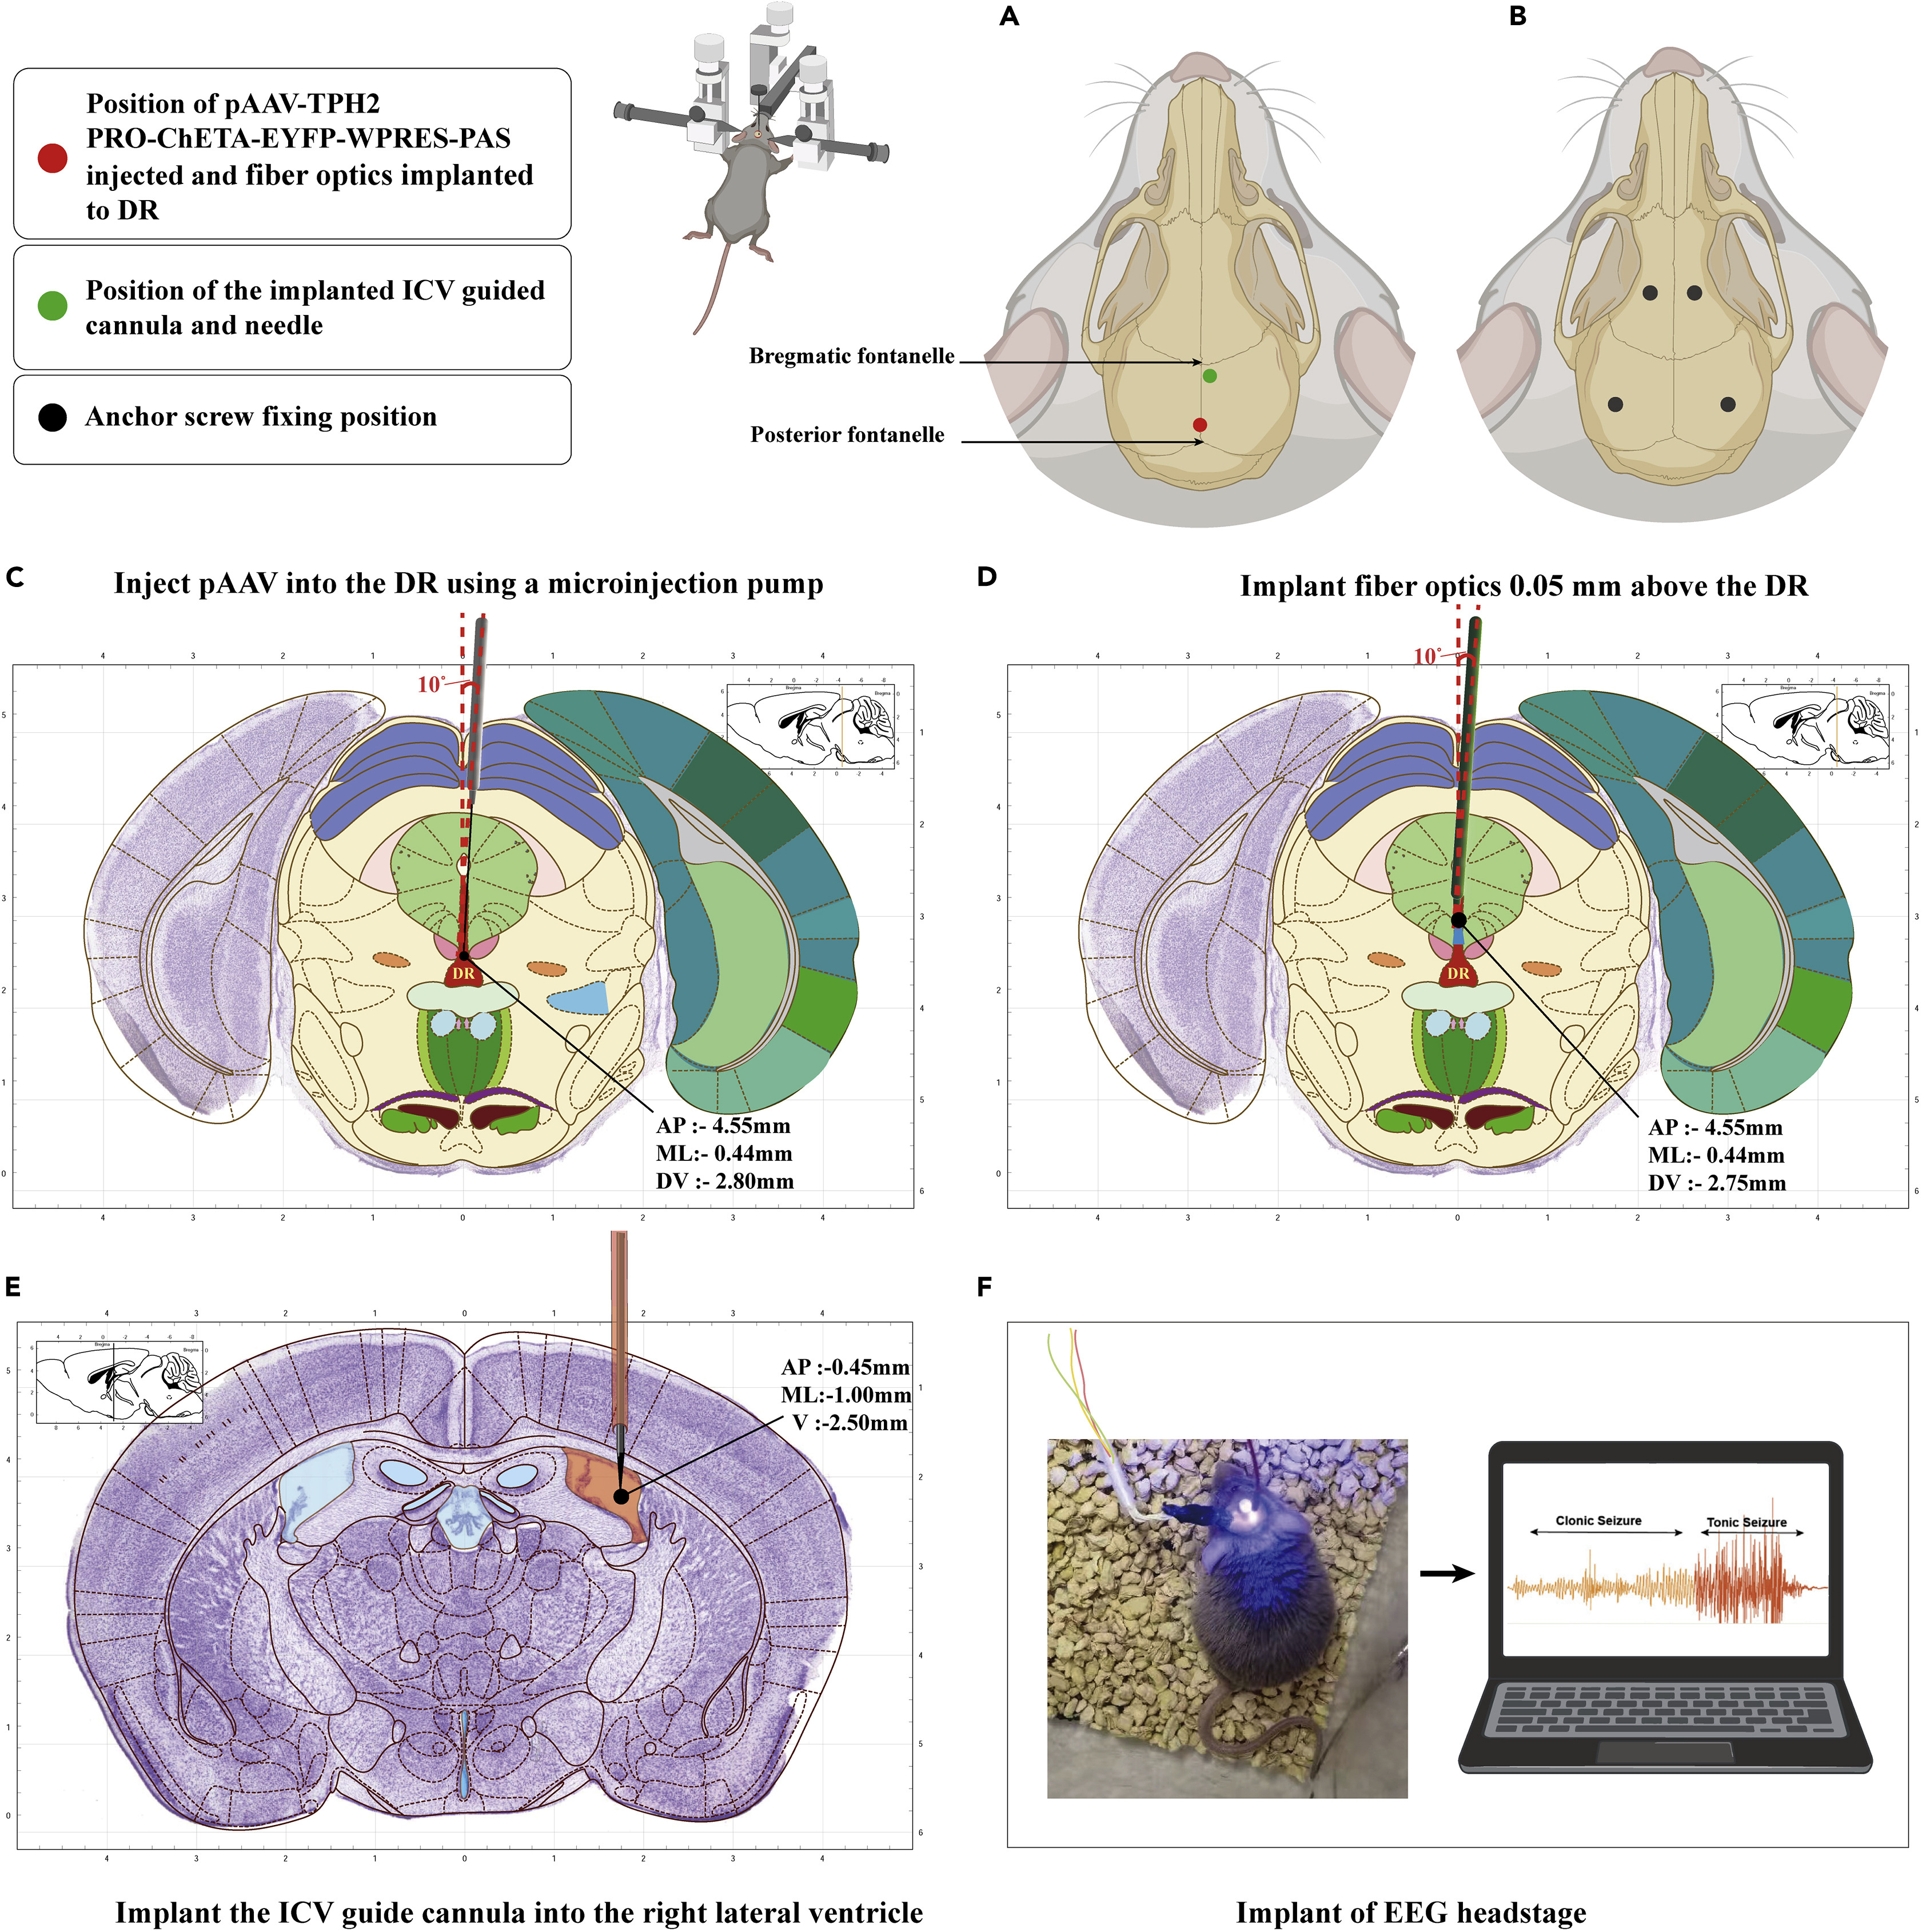
Because the dorsal raphe nucleus (DR) lies beneath dense midline blood vessels where vertical needle insertion frequently causes fatal hemorrhage, the authors employ a 10° right-tilted stereotaxic approach. Specifically, 100 nL of serotonergic-specific optogenetic virus (pAAV-TPH2-PRO-ChETA-EYFP-WPRES-PAS) is infused into the DR (AP −4.55 mm, ML −0.44 mm, DV −2.80 mm, 10° right) at 20 nL/min with a 10-minute post-infusion dwell time, followed by implantation of an optical fiber 0.05 mm dorsal to the injection site (DV −2.75 mm, 10° right) to illuminate DR TPH2-expressing neurons while sparing overlying vasculature.
To test whether central 5-HT2A receptors mediate the protective effect of systemic 5-hydroxytryptophan (5-HTP) or DR photostimulation against S-IRA, an intracerebroventricular (ICV) guide cannula is implanted into the right lateral ventricle (AP −0.45 mm, ML −1.00 mm, DV −2.50 mm) alongside four skull anchor screws and cortical electroencephalogram (EEG) electrodes. Microinjection of the 5-HT2A receptor antagonist ketanserin (KET, 18.30 nmol) via the ICV cannula reverses the suppression of S-IRA conferred by either 5-HTP administration or optogenetic activation of DR serotonergic neurons during clonic and tonic seizures.
Source: Wang Y et al. · STAR protocols · © 2023 The Author(s)This is an open access article under the CC BY-NC-ND license (http://creativecommons.org/licenses/by-nc-nd/4.0/).
Original figure and English caption ↗
Dorsal Raphe Optogenetic Activation Combined with Bilateral Pre-Bötzinger Complex Microinjection
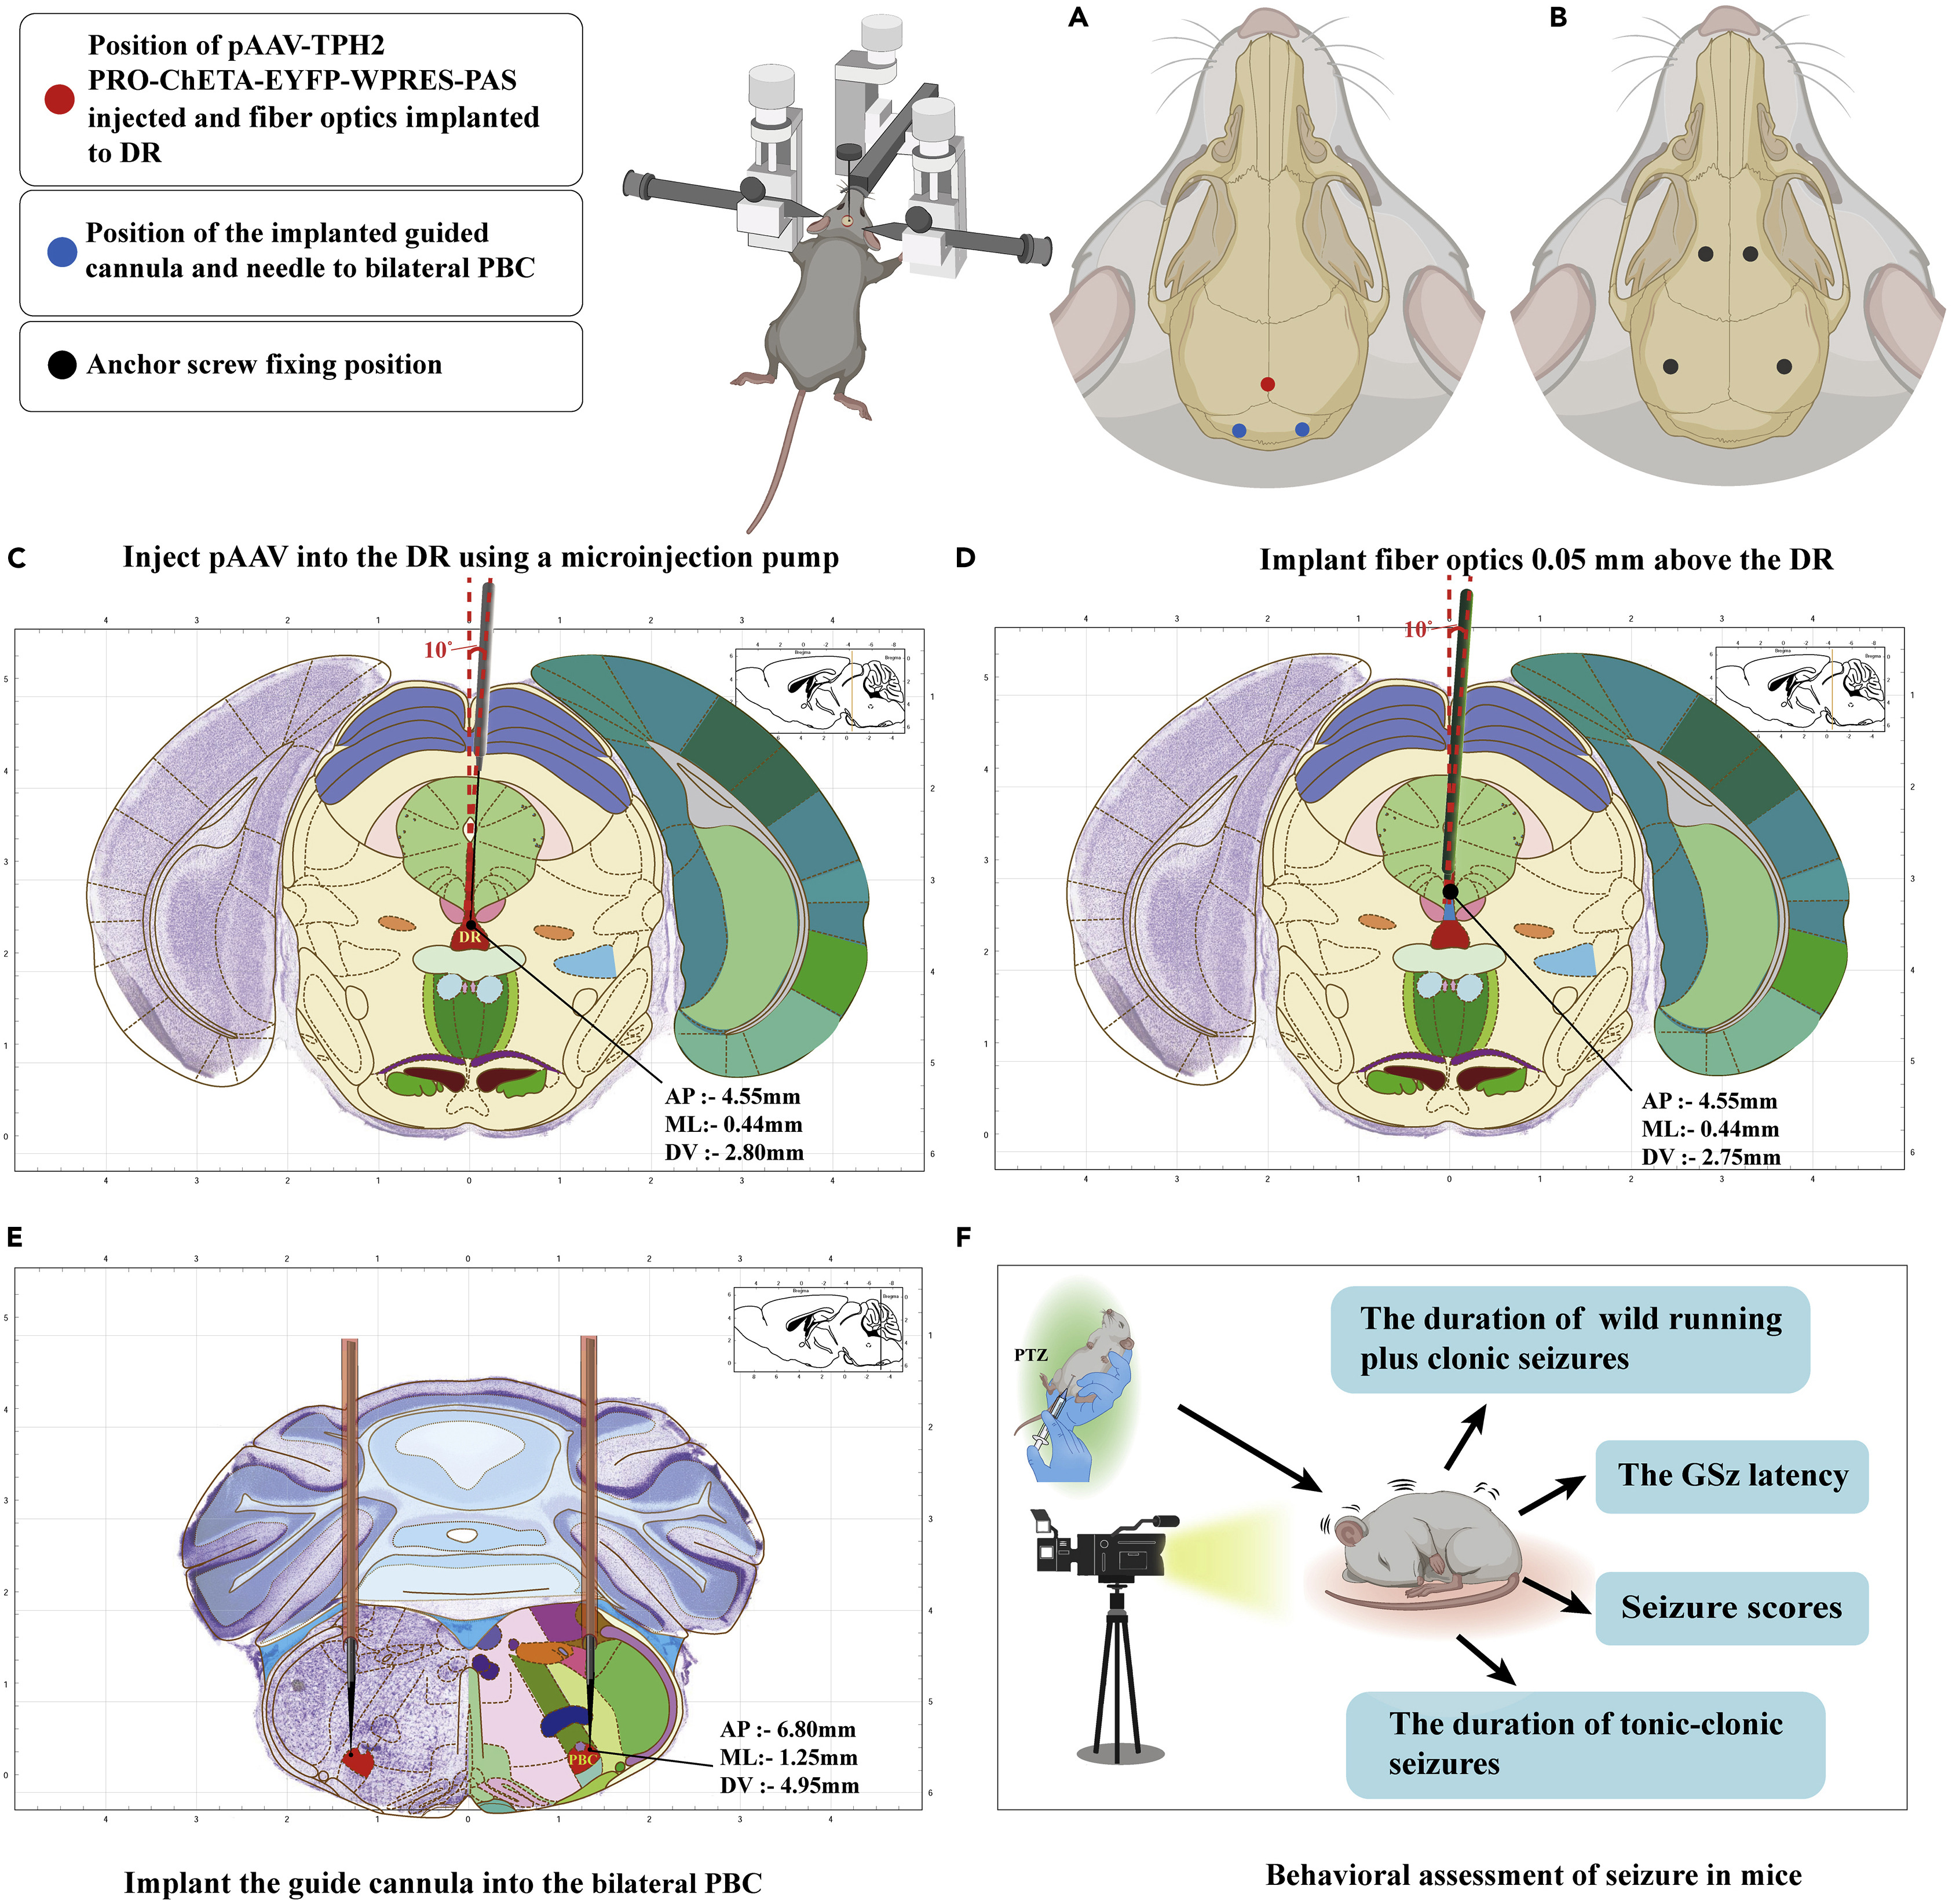
To pinpoint whether the pre-Bötzinger complex (PBC) is the specific downstream target mediating the anti-S-IRA effect of dorsal raphe (DR) photostimulation, the protocol pairs DR optogenetic activation with bilateral intra-PBC pharmacological blockade. In the same surgical session, mice receive 10°-angled pAAV-TPH2-PRO-ChETA-EYFP-WPRES-PAS infusion and optical fiber implantation above the DR together with bilateral guide cannulas aimed at the PBC (AP −6.80 mm, ML −1.25 mm, DV −4.95 mm), secured to four skull screws with dental cement.
Following a minimum 3-week viral expression period, ketanserin (KET) is microinjected bilaterally into the PBC prior to blue-light photostimulation of the DR (465 nm, 20 Hz, 20-ms pulse width, 15 mW, 20 min) and intraperitoneal PTZ challenge. Video-based behavioral assessment—tracking wild running plus clonic seizure duration, generalized seizure latency, seizure scores, and tonic-clonic seizure/S-IRA incidence—demonstrates that localized KET delivery into the bilateral PBC reverses the DR photostimulation-mediated reduction in PTZ-induced S-IRA, confirming that DR serotonergic projections prevent respiratory arrest by activating PBC 5-HT2A receptors.
Source: Wang Y et al. · STAR protocols · © 2023 The Author(s)This is an open access article under the CC BY-NC-ND license (http://creativecommons.org/licenses/by-nc-nd/4.0/).
Original figure and English caption ↗
Bilateral Optical Fiber and Guide Cannula Configuration in the Pre-Bötzinger Complex
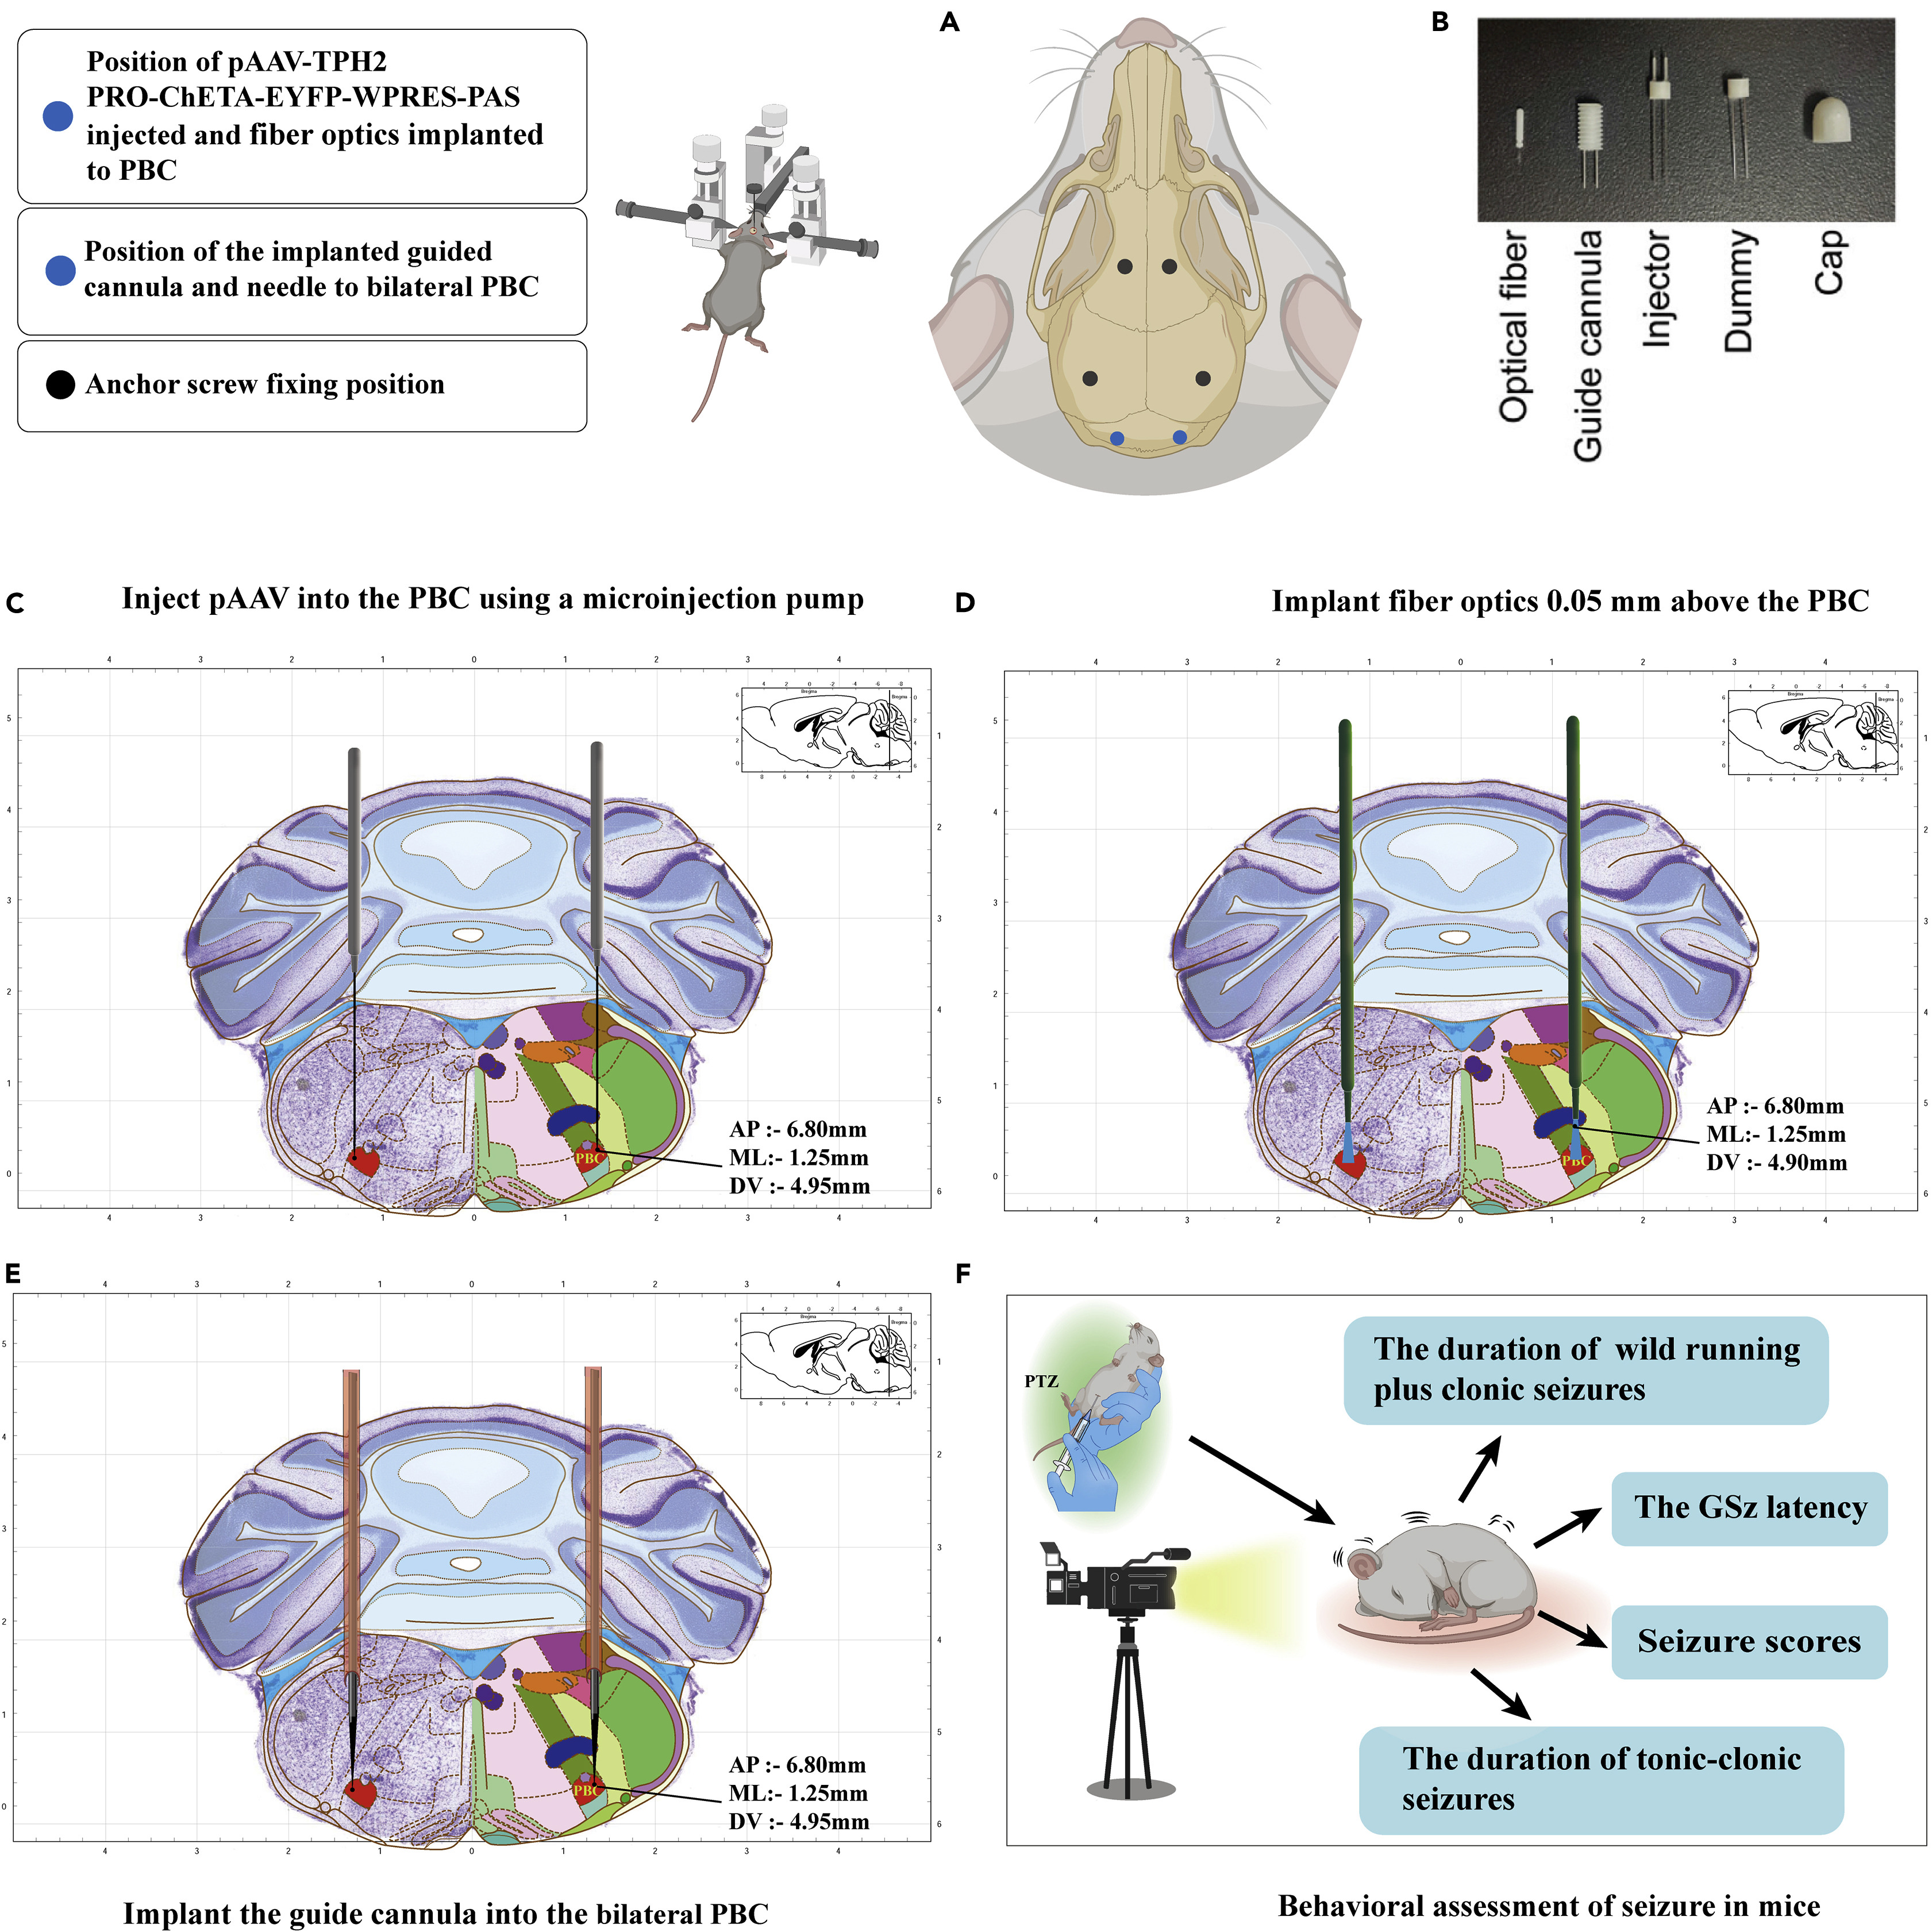
Beyond somatic stimulation in the DR, the protocol also outlines bilateral viral delivery, optical fiber implantation, and guide cannula placement directly within the pre-Bötzinger complex (PBC) (Figure 7). In this configuration, pAAV-TPH2-PRO-ChETA-EYFP-WPRES-PAS is microinjected bilaterally into the PBC (AP −6.80 mm, ML −1.25 mm, DV −4.95 mm), followed by bilateral placement of optical fibers 0.05 mm above the target (DV −4.90 mm) or bilateral guide cannulas equipped with matching injectors, dummy cannulas, and protective caps for local optogenetic and pharmacological manipulation.
After behavioral testing, animals are perfused for 30-μm coronal cryosectioning to verify optical fiber and cannula tip placements. Endogenous EYFP epifluorescence is directly visible without immunostaining, while tryptophan hydroxylase 2 (TPH2), c-fos, and neurokinin-1 receptor (NK1R)—a canonical anatomical marker of the PBC—are examined to confirm region-specific viral expression and neuronal activation.
Source: Wang Y et al. · STAR protocols · © 2023 The Author(s)This is an open access article under the CC BY-NC-ND license (http://creativecommons.org/licenses/by-nc-nd/4.0/).
Original figure and English caption ↗
Dorsal Raphe Photostimulation Coupled with Bilateral Pre-Bötzinger Complex Fiber Photometry
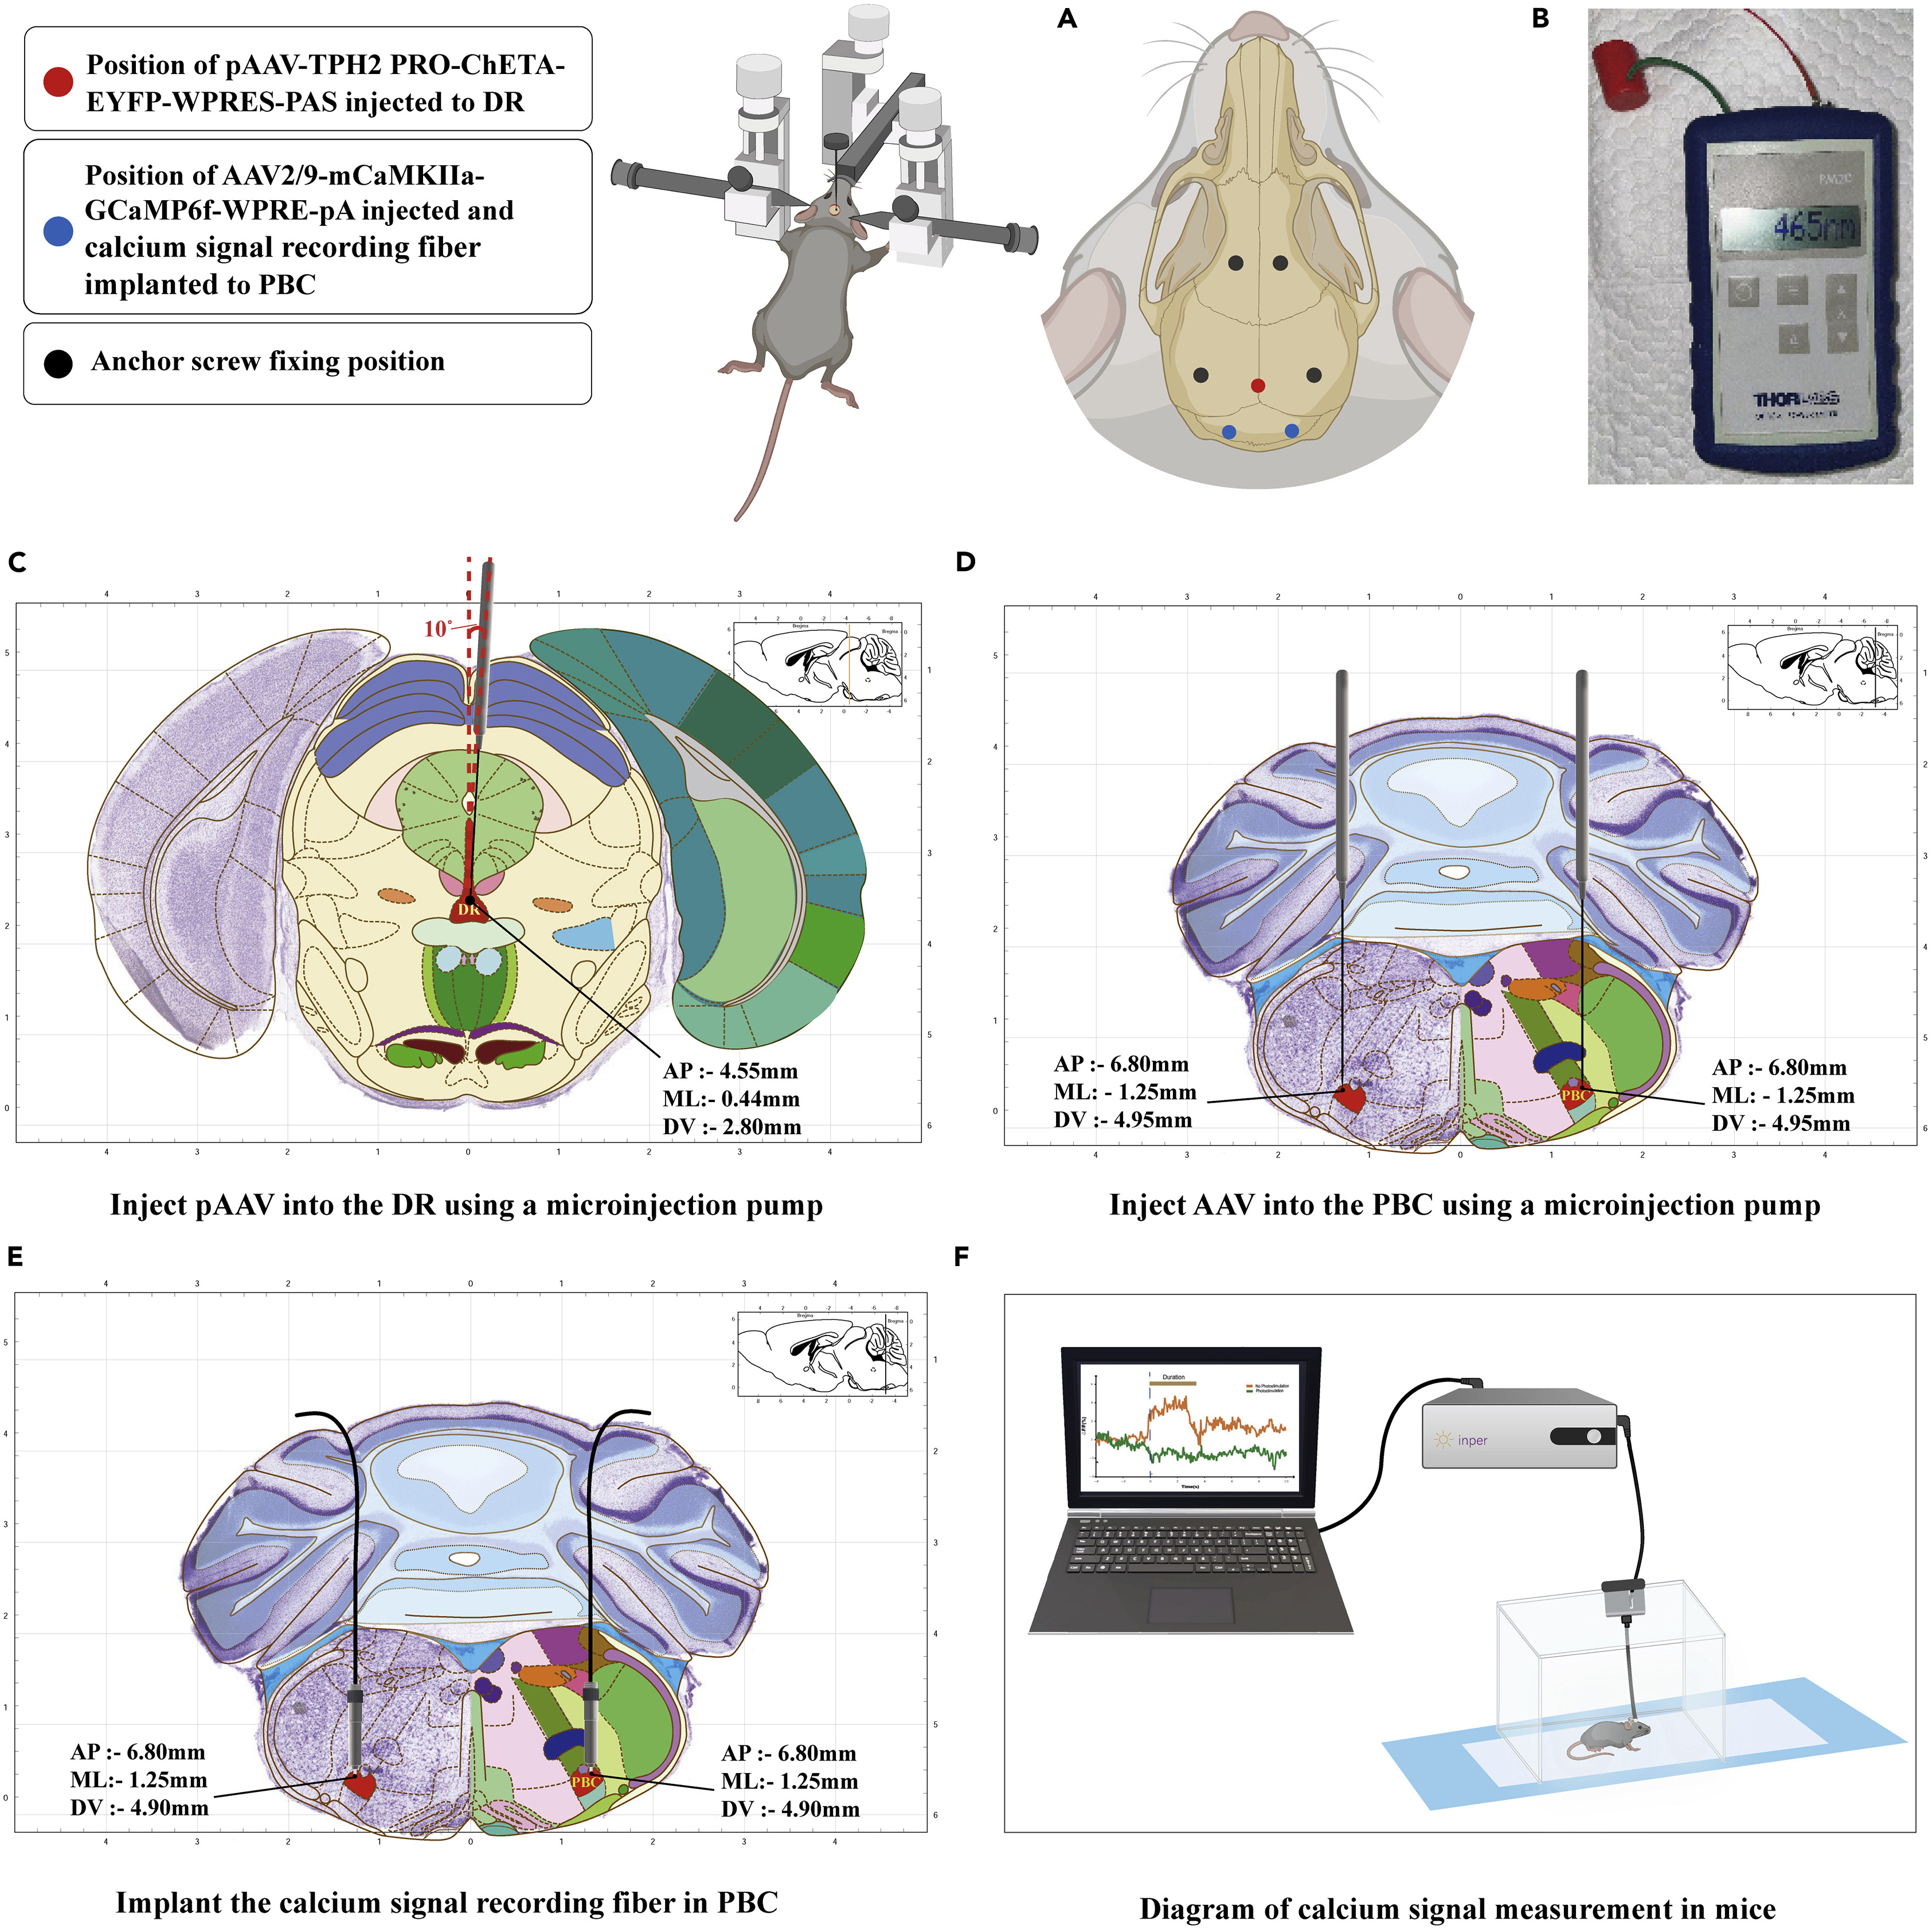
To directly monitor how dorsal raphe (DR) serotonergic activation modulates population neuronal activity in the pre-Bötzinger complex (PBC) in freely moving mice, the protocol combines DR photostimulation with bilateral PBC fiber photometry. Mice receive pAAV-TPH2-PRO-ChETA-EYFP-WPRES-PAS and an angled stimulating fiber in the DR alongside bilateral PBC microinjections of the genetically encoded calcium indicator AAV2/9-mCaMKIIa-GCaMP6f-WPRE-pA (AP −6.80 mm, ML −1.25 mm, DV −4.95 mm) and bilateral recording fibers implanted 0.05 mm above the PBC (DV −4.90 mm).
Prior to testing, mice are handled and habituated to a dark recording chamber, and a portable optical power meter is used to verify 465 nm output intensity at the ceramic sleeve tip before connecting the animal. Using black ceramic ferrules and sleeves to minimize ambient light leakage, the photometry system simultaneously records 488 nm calcium-dependent fluorescence and a 410 nm isosbestic reference channel to subtract motion and background artifacts, enabling quantitative comparison of peak ΔF/F calcium transients in the bilateral PBC during clonic and tonic seizures with and without DR photostimulation.
Source: Wang Y et al. · STAR protocols · © 2023 The Author(s)This is an open access article under the CC BY-NC-ND license (http://creativecommons.org/licenses/by-nc-nd/4.0/).
Original figure and English caption ↗