Reading optical and electrical responses to the same stimulation
A combined optrode records calcium fluorescence and local electrical signals in rat thalamus and compares them with electrical-field and light-propagation models, revealing differences in timing and assumptions.

After electrical stimulation reaches brain tissue, electrical recordings change rapidly while calcium-indicator fluorescence may rise later. Both describe the same event on different timescales. A study published in Biosensors on February 13, 2023 combines an optical fiber and multichannel neural probe to record local electrical signals and GCaMP6s fluorescence near rat ventral posteromedial thalamus (VPM). Electrical-field and light-propagation models are compared with in-vivo recordings, asking both how to observe the responses together and under which conditions signals and models correspond.
Under acute tested conditions, stronger stimulation accompanies larger fluorescence and electrical measures and fitted relationships with simulated volume. Artifacts, indicator dynamics and model assumptions shape interpretation.
Contents · 6 sections
Giving optical and electrical signals a shared observation window
Electrical recording captures rapid changes, while calcium fluorescence offers another activity-related view. Separate measurements can differ in animal, location or stimulus conditions. Combining a fiber and flexible neural probe allows stimulation and electrical and fluorescence acquisition within the same acute experiment.
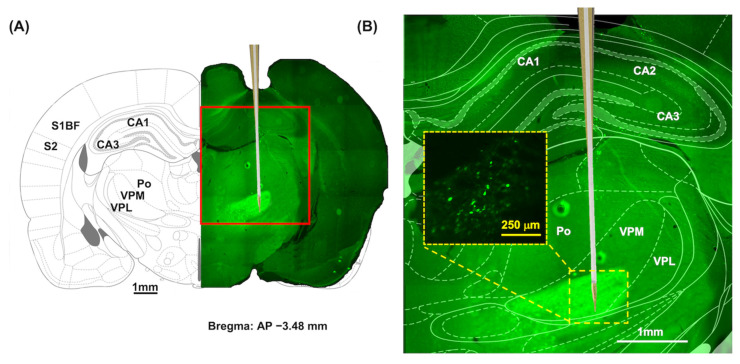
Different electrodes serve stimulation and recording roles, while the fiber delivers excitation and collects fluorescence. Post-experiment tissue images show GCaMP expression in the relevant thalamic region. This spatial combination supplies a shared context for comparing modeled stimulation extent with optical observations.
Source: Liang YW et al. · Biosensors · CC BY
Original figure and English caption ↗
Estimating stimulation extent in virtual tissue
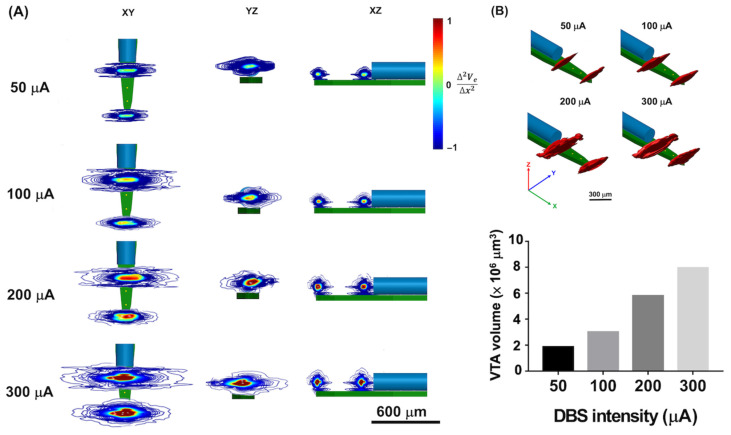
Finite-element modeling estimates field-related distributions at different stimulation strengths, focusing on source and reference electrodes. Stronger stimulation yields more voxels meeting the specified criterion and a larger estimated activated-tissue volume, visualized across three spatial planes.
The volume is a spatial estimate from a model criterion rather than a region assembled by recording every active cell. Tissue electrical properties are assumed homogeneous and isotropic, allowing clear comparison of stimulation strength and predicted spatial extent.
Source: Liang YW et al. · Biosensors · CC BY
Original figure and English caption ↗
Turning predicted regions into a fluorescence model
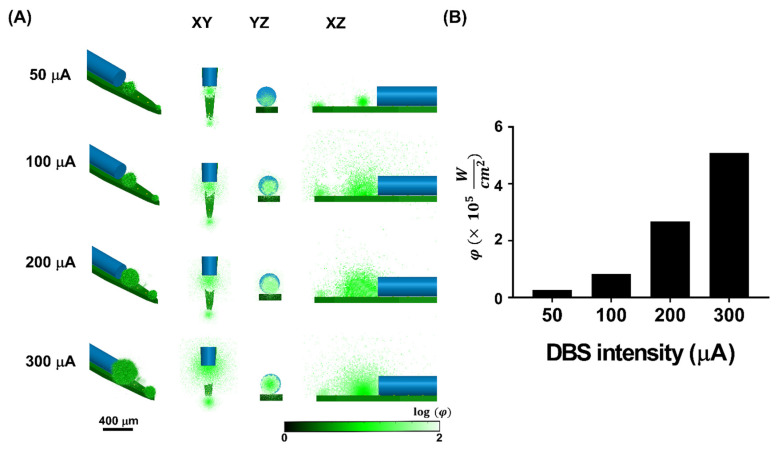
Monte Carlo light-propagation modeling uses the field model’s predicted regions as fluorescence-emitting regions. Under a uniform fluorescence-efficiency assumption, stronger stimulation and larger predicted volumes produce greater simulated fluorescence extent and summed intensity. The electrical and optical models therefore share part of their input.
The model links excitation, emission and tissue propagation to estimate signals available to the fiber. Real indicator expression, cellular responses and scattering are not perfectly uniform, motivating comparison with in-vivo results.
Source: Liang YW et al. · Biosensors · CC BY
Original figure and English caption ↗
Fast electrical changes meet slower fluorescence in vivo
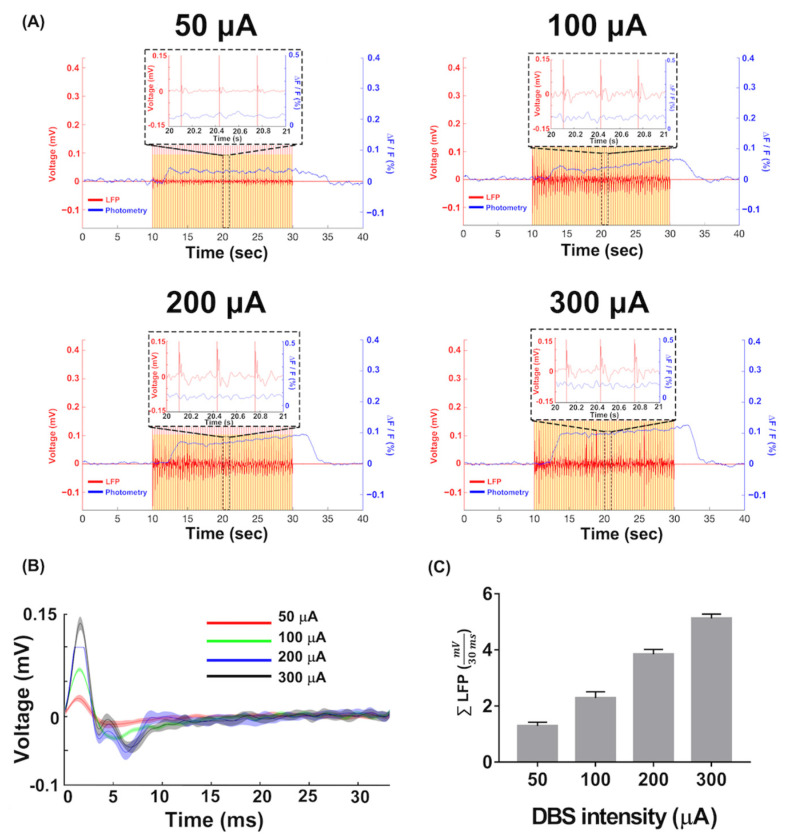
In anesthetized acute experiments involving five rats, stronger stimulation accompanies larger local electrical measures and fluorescence changes. Calcium rises about five seconds after stimulation begins, while electrical traces respond rapidly, exposing different timescales of the same event.
Electrical traces retain stimulation-related artifacts and therefore include effects of measurement and stimulation itself. The team summarizes absolute waveform amplitudes in a selected post-stimulus interval for comparison. Calcium signals are shaped by indicator responses and population averaging, unlike single-unit recordings that resolve individual action potentials.
Source: Liang YW et al. · Biosensors · CC BY
Original figure and English caption ↗
Close fits retain their experimental conditions
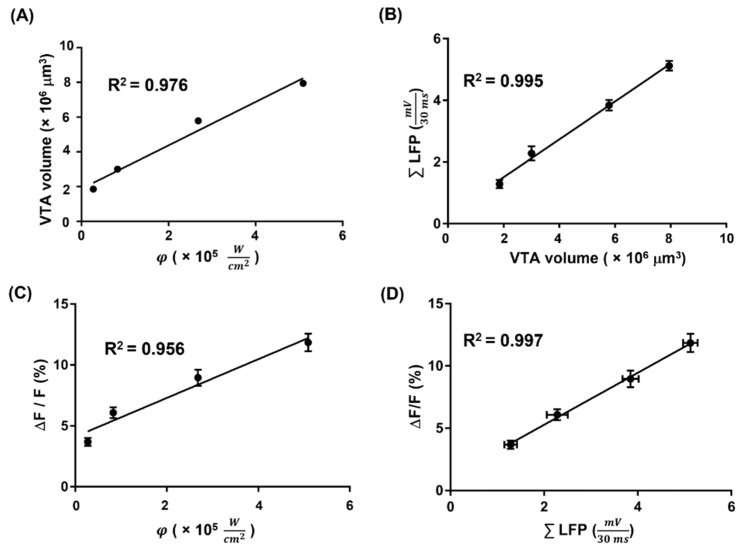
Across tested strengths, predicted activated volume fits positively with simulated fluorescence and, under best-fit conditions, with the in-vivo electrical summary. Simulated and measured fluorescence and electrical summaries also show strong linear fits. These four comparisons link models with recordings from the experiment.
The fits derive from a small set of tested stimulus conditions rather than independent prediction in new animals. Uniform fluorescence efficiency is assumed, while actual expression and calcium dynamics affect correspondence. The discussion identifies expression efficiency among factors for further model adjustment.
Source: Liang YW et al. · Biosensors · CC BY
Original figure and English caption ↗
Complementary observations also reveal their differences
The combined probe lets optical and electrical observations interact within a shared location and stimulation context: one is fast, one slower; one faces electrical artifacts, the other expression and indicator dynamics. Modeling adds spatial estimates for comparing signal changes with predicted extent.
Validation concerns anesthetized acute thalamic experiments in eight-week-old Sprague–Dawley rats, without testing long-term implantation, freely moving behavior or disease treatment. It demonstrates concurrent recording and model comparison while highlighting realistic expression distributions and timing as important conditions for interpreting correspondence.