Seeing each cell more clearly with a soma-localized red calcium indicator
A new indicator concentrates fluorescence in neuronal cell bodies, reducing surrounding-fiber interference, resolving more cells in zebrafish and mice, and reducing apparent synchrony from mixed signals.

A dense neural network resembles a room where many people speak at once: hearing sound is not enough; one must identify its source. In calcium imaging, fluorescence from nearby axons and dendrites can enter cell-body signals, making neighboring cells appear more synchronized. A study published on April 29, 2025 in PLOS Biology develops the red calcium indicator FRCaMPi and its soma-localized version, SomaFRCaMPi. By strengthening responses to calcium and concentrating signals in cell bodies, the study resolves more cells in dense zebrafish and mouse tissue.
Concentrated signals can be more useful than a brighter overall image: under some imaging conditions, SomaFRCaMPi combines lower baseline brightness with clearer cell identification and improved signal-to-noise ratio.
Contents · 7 sections
Beyond color, signals must be disentangled
Red calcium indicators can be used alongside green probes, providing another color for observing multiple signals. Different colors do not automatically provide cellular resolution, however. Strong fluorescence from surrounding fibers can obscure cell-body boundaries and add the same background fluctuation to several cellular recordings.
The study addresses two problems together: can a molecule report calcium more sensitively, and can more of its signal remain in the soma? The first concerns detecting change, the second identifying its source. Together they help distinguish cells within a crowded image.
Source: Zhou S et al. · PLoS biology · CC BY
Original figure and English caption ↗
Changing topology improves calcium sensitivity
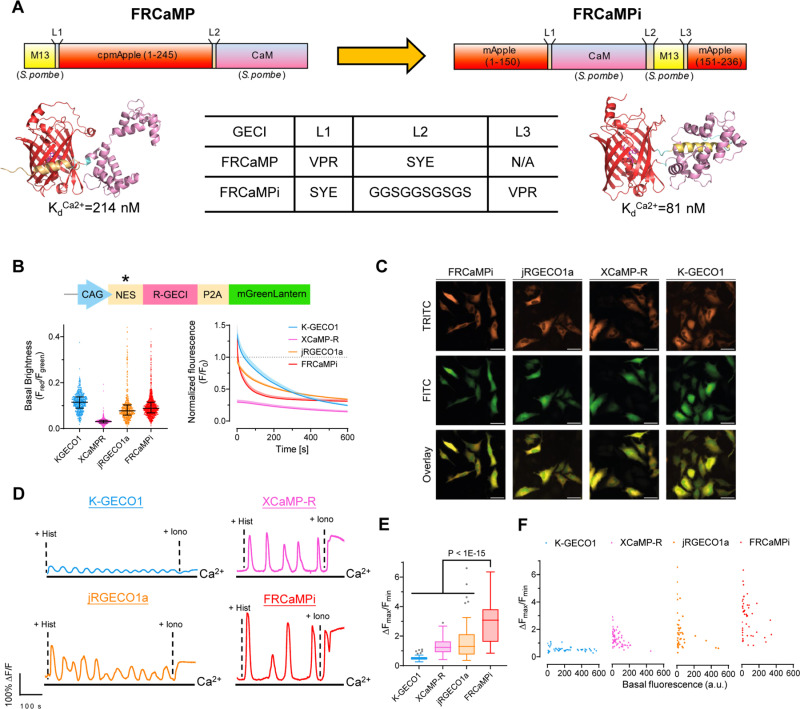
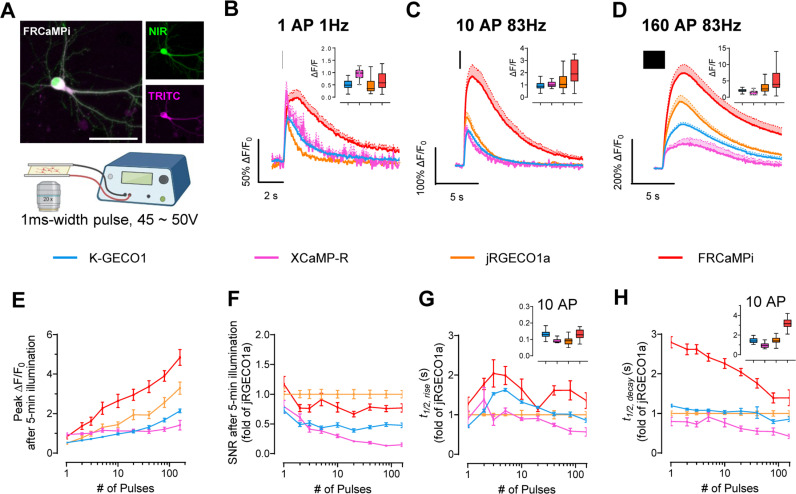
FRCaMPi reorganizes the topology of the existing FRCaMP indicator. Calcium-binding affinity increases while its large dynamic range is retained. In cultured neurons, a single stimulus evokes a fluorescence peak about fifty to sixty percent larger than that of the commonly used jRGECO1a, with stronger responses also seen at higher stimulus counts.
Higher affinity has a trade-off: tighter calcium binding can slow response decay. FRCaMPi decays more slowly than some comparators in culture and photobleaches faster under sustained illumination. A larger fluorescence change therefore does not imply improvement in every imaging property.
Source: Zhou S et al. · PLoS biology · CC BY
Original figure and English caption ↗
Less background can also mean lower baseline brightness
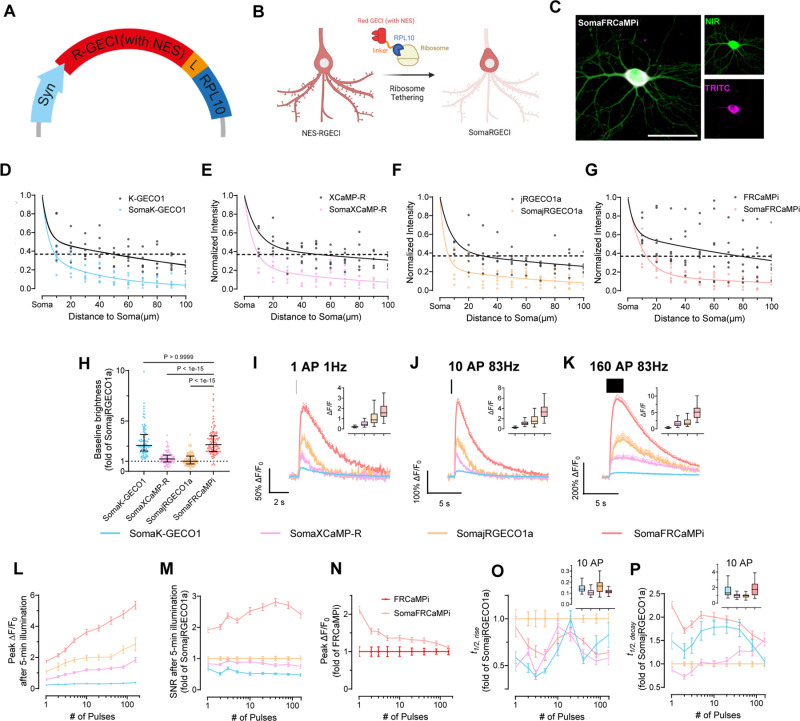
A ribosome-associated RPL10 localization tag concentrates FRCaMPi in cell bodies, producing SomaFRCaMPi. Fluorescence falls more steeply along neurites, dimming surrounding fibers and making somatic boundaries easier to identify. Illumination is concentrated on the intended subject.
Localization lowers baseline brightness without eliminating function. SomaFRCaMPi retains strong responses and favorable signal-to-noise ratios in cultured neurons. Other tested red indicators lose more brightness or responsiveness after comparable targeting, showing that the outcome depends on the pairing of indicator and localization strategy.
Source: Zhou S et al. · PLoS biology · CC BY
Original figure and English caption ↗
More cell bodies emerge as background recedes
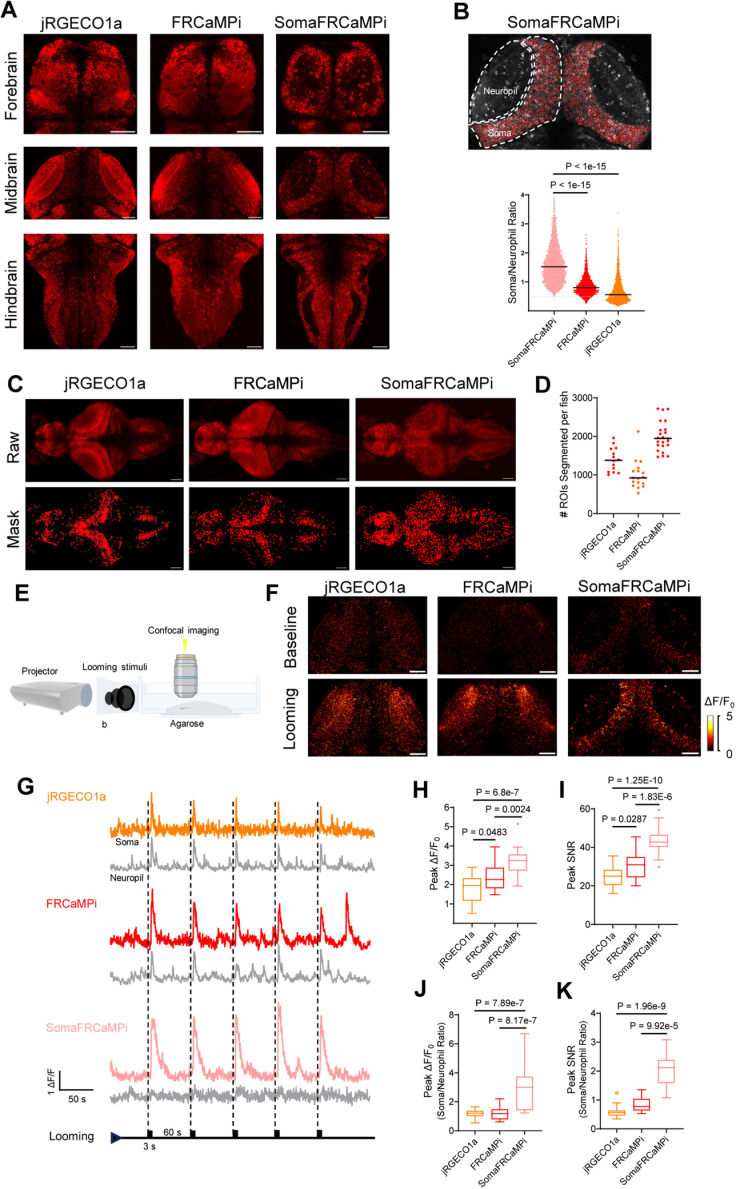
In zebrafish larvae, soma localization markedly reduces fluorescence in neuropil-rich regions. Automated segmentation identifies roughly twice as many cellular regions in SomaFRCaMPi images as in non-targeted FRCaMPi images. Cell bodies previously obscured by neuropil background become visible in clearer images.
An expanding visual shadow evokes clear, reproducible calcium responses in optic-tectal cells. SomaFRCaMPi produces stronger somatic responses and signal-to-noise ratios while surrounding neuropil responses are weaker, helping turn a responding brain region into identifiable responding cell bodies.
Source: Zhou S et al. · PLoS biology · CC BY
Original figure and English caption ↗
Reducing apparent synchrony while retaining responses
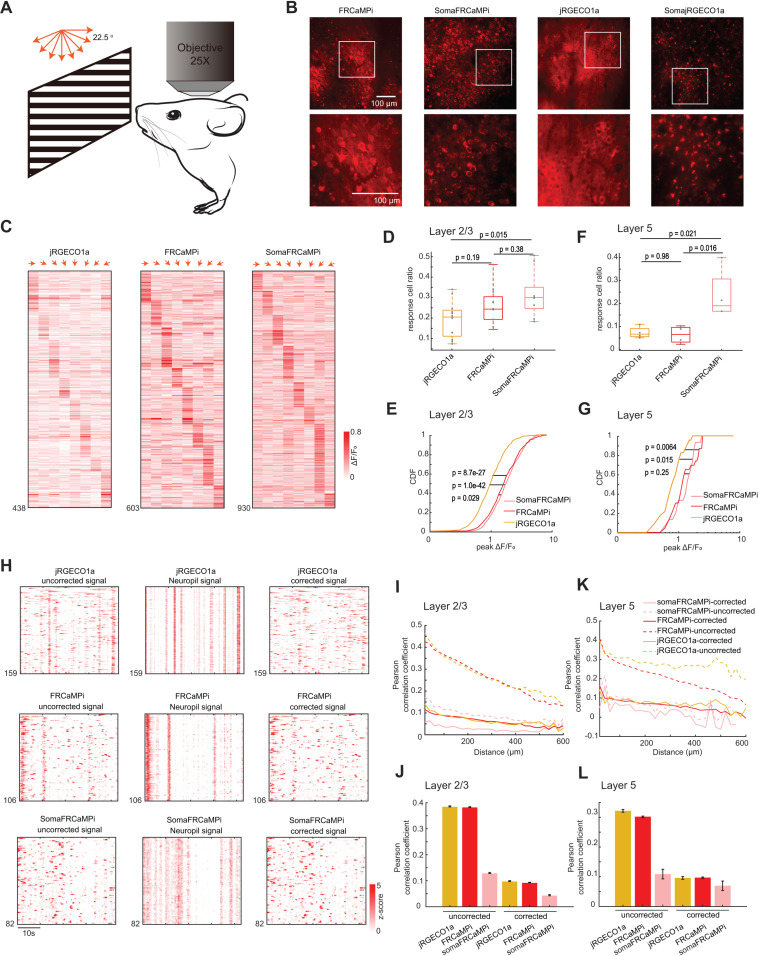
In two-photon imaging of mouse visual cortex, the new indicator reports selective responses to drifting-grating directions and identifies more responsive cells. Responses remain detectable deeper in cortex, but signal-to-noise ratios converge among indicators, showing that benefits depend on imaging depth.
Recorded correlations between cells fall as surrounding-neuropil background decreases. Background-subtraction analyses further support that shared fiber signals contribute to some apparent synchrony. Reducing optical mixing brings the recordings closer to cellular responses and relationships.
Source: Zhou S et al. · PLoS biology · CC BY
Original figure and English caption ↗
A dimmer image can reveal cells more clearly
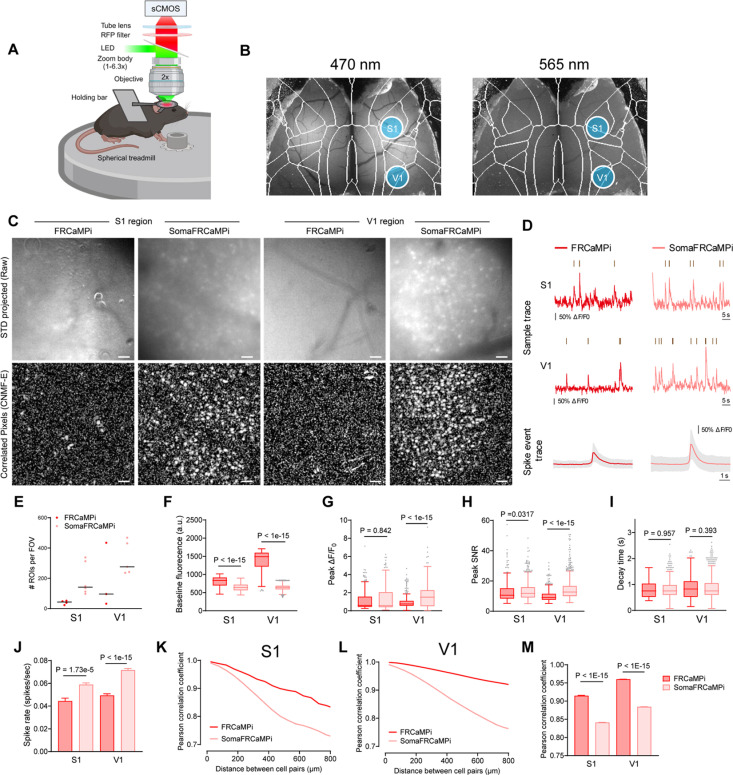
In densely labeled mouse-cortical wide-field imaging, SomaFRCaMPi has lower baseline brightness than the non-targeted version yet resolves approximately three times as many cellular regions. Signal-to-noise ratios improve by about ten percent in primary somatosensory cortex and forty percent in visual cortex, showing the value of reducing background.
More calcium events are detected and shared signal contamination between cells is reduced. Lower background reveals changes previously concealed in the image, so indicator performance depends on how many cells can be identified and how clearly signals can be assigned, as well as on brightness.
Source: Zhou S et al. · PLoS biology · CC BY
Original figure and English caption ↗
Red and green have complementary strengths
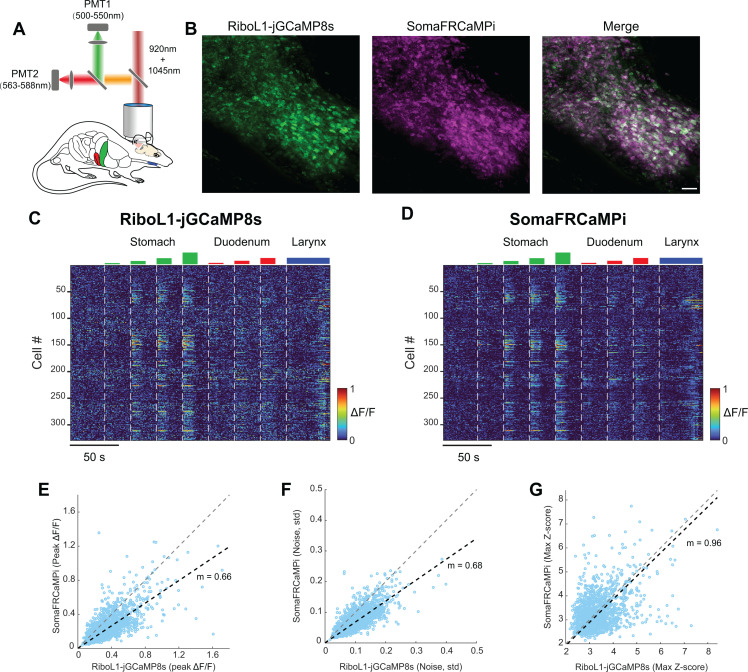
Compared with a highly sensitive green soma-targeted indicator in the same nucleus-of-the-solitary-tract cells, SomaFRCaMPi has smaller response amplitudes but lower baseline noise, yielding similar standardized signals. The red version adds an option for observing single-cell activity alongside other signals in a green channel.
Responses remain detectable in long-term mouse recordings, although response amplitudes decline over months for both tested indicators. Photostability, decay kinetics and aggregation under dense expression still shape applications. The study’s central gain is combining stronger molecular responses with control of signal location to make single-cell recordings in dense tissue more distinguishable.
Source: Zhou S et al. · PLoS biology · CC BY
Original figure and English caption ↗