Putting part of the estrogen response under light control: OptoER links nuclei, genes and epithelium
Cell and female-mouse proof-of-concept experiments connect light-controlled localization with part of estrogen-related transcription, while genes and tissue readouts retain distinct responses.
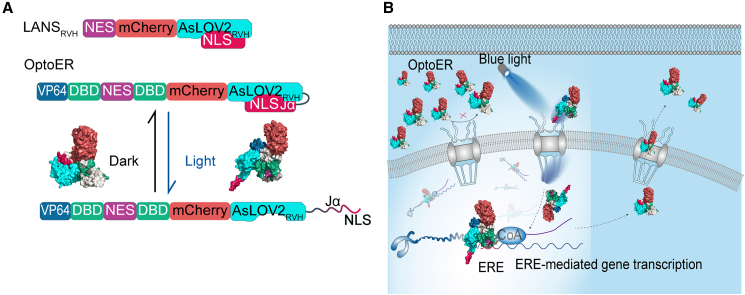
One hormone can affect many tissues and trigger diverse responses. Could part of that activity be examined at a particular place and time? An iScience study introduces the light-controlled module OptoER, linking its nuclear localization with estrogen-responsive genes. Cultured cells show light-associated nuclear accumulation and expression changes; a female-mouse model shows local epithelial differences. Across localization, transcription and tissue, the work explores selective engagement of part of an estrogen-like response.
OptoER light–dark localization changes accompany responses in several target genes and local epithelial differences in estrogen-deficient mice, providing proof of concept for part of the transcriptional function.
Contents · 6 sections
Selecting part of a hormone’s transcriptional response
Estrogen receptors work with tissue-specific regulators to produce diverse gene and cellular changes. The study narrows the question to estrogen-response-element-associated transcription: can selected programs follow light-controlled localization? This creates a smaller window into hormonal complexity, allowing location and expression to be compared.
OptoER accumulates in nuclei under light and gradually exits in darkness. The design connects location with transcription, followed by cellular and tissue observations. These levels relate to one another but have distinct timing and readouts. Nuclear changes precede the question of whether genes and tissue respond, forming the study’s sequence.
Source: Liu J et al. · iScience · CC BY-NC
Original figure and English caption ↗
Nuclear accumulation can rise and fall repeatedly
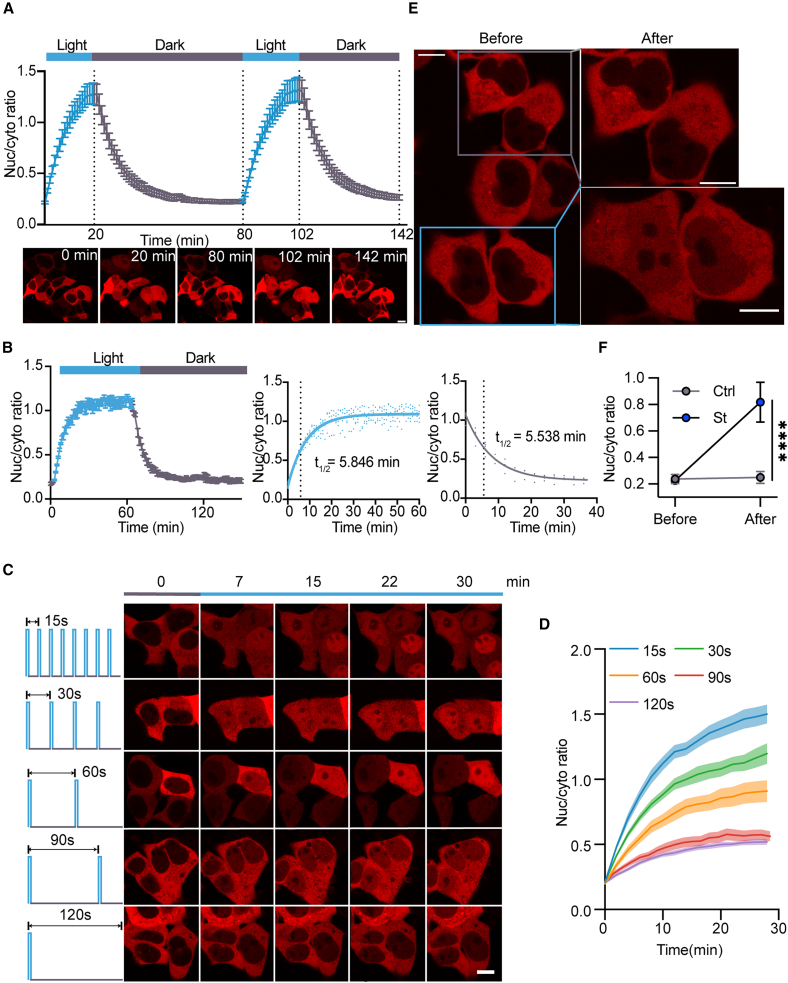
Repeated light–dark changes produce repeated nuclear accumulation and recovery in cultured cells. Illuminated cells show stronger localization changes than nearby unilluminated cells. Images therefore show both spatial and temporal selectivity. Entry and exit half-response times are about five to six minutes, describing a process on the scale of minutes.
These findings first establish movement and its relationship with light and darkness. Transcription, proteins and tissue structure need not follow localization on the same schedule. Expression observations then ask which estrogen-related targets respond as nuclear accumulation rises, and whether their responses have similar magnitudes.
Source: Liu J et al. · iScience · CC BY-NC
Original figure and English caption ↗
Several genes respond, with different magnitudes
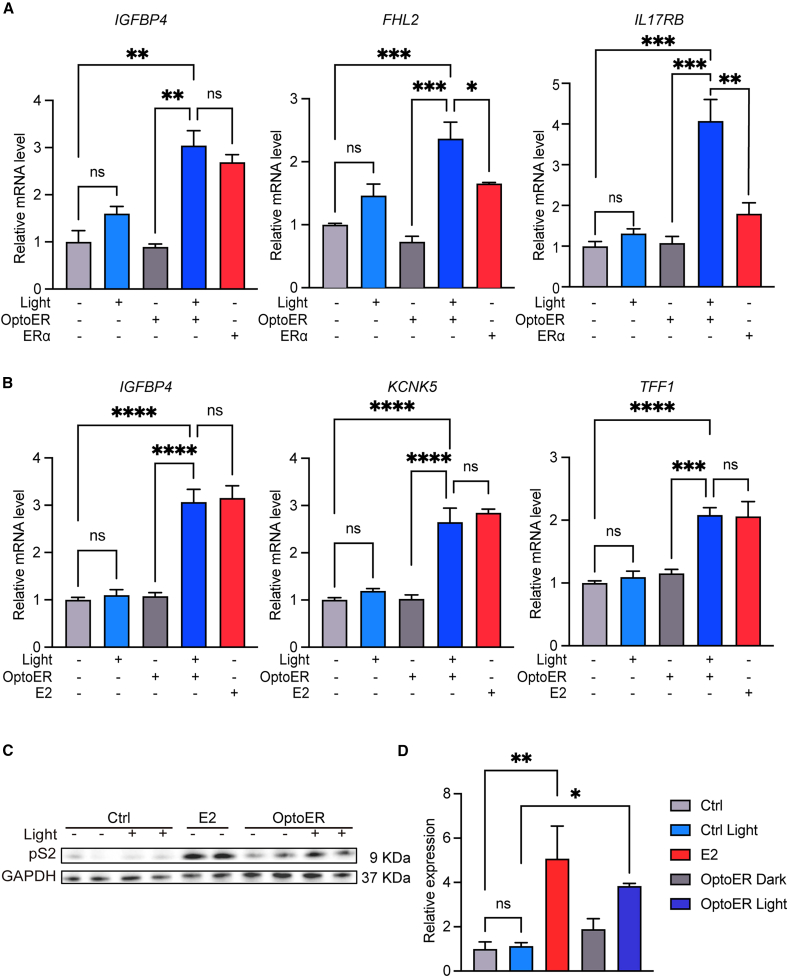
Several tested target genes increase after light activation in HEK293T and MCF-7 cells, and MCF-7 pS2 protein also rises. Light-only controls without the corresponding module do not reproduce the expression pattern. Localization connects with downstream responses, showing engagement of part of the examined transcriptional program.
Responses differ among genes: some approach receptor or estradiol references, while others diverge. Live-cell counts and migration also change. MCF-7 is tumor-derived, so proliferation-related readouts describe functional responses in that model. Genes, protein and behavior reveal both the module’s activity and its differences from natural hormone responses.
Source: Liu J et al. · iScience · CC BY-NC
Original figure and English caption ↗
Local epithelium changes beyond transcription
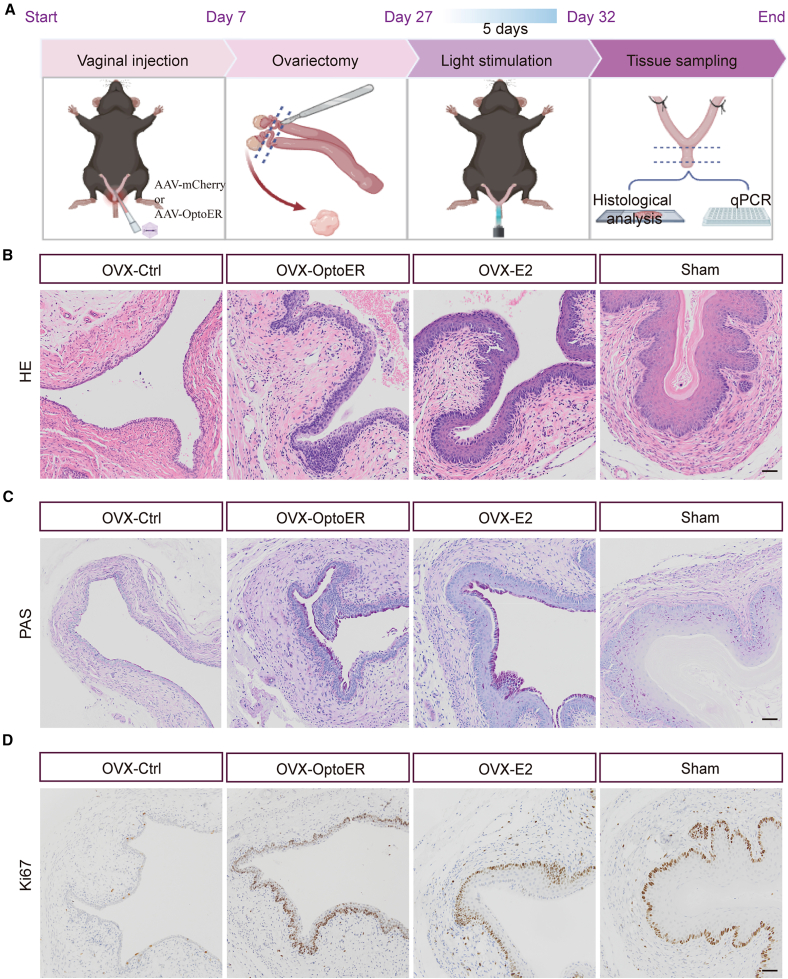
The study examines vaginal epithelium in ovariectomized female mice. Control epithelium is thinner, while representative light-controlled sections show more layers and folds, with corresponding PAS and Ki67 staining differences. Estradiol and sham groups provide references for estrogen-deficient and relatively normal structure.
The local module was established before ovariectomy, and tissue observations come from three mice per group. This timing and sample scope define a proof of concept under specific conditions: localization and expression effects are accompanied by tissue differences in vivo. Local structure and markers provide an initial bridge between cellular and tissue levels.
Source: Liu J et al. · iScience · CC BY-NC
Original figure and English caption ↗
Epithelial changes do not require every gene to rise
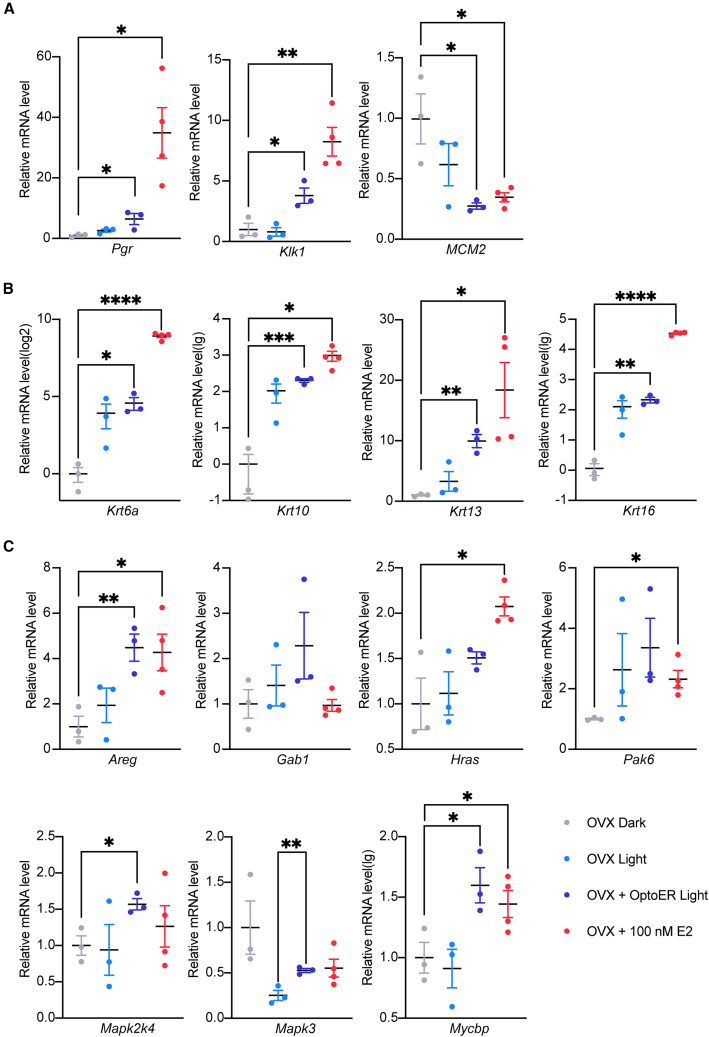
In tissue, Pgr and Klk1 increase while Mcm2 decreases; proliferation-related Ki67 staining and Mcm2 transcription also differ in direction. They measure distinct molecules and levels, so epithelial structure cannot be summarized by one uniform rise. Each readout has a separate biological place in the local response.
Keratinization-related genes also change in light-only controls, and incremental OptoER effects are not significant across all targets. Growth-signaling genes respond with different strengths. Tissue responses form a varied pattern: selected programs and light-associated background changes together shape the final expression landscape.
Source: Liu J et al. · iScience · CC BY-NC
Original figure and English caption ↗
Location, transcription and tissue form three comparable levels
The central insight is that estrogen-related functions can be examined in parts. Light-controlled localization connects selected gene responses with local tissue changes, forming preliminary evidence across cells and animals. These observations do not determine long-term stability or safety, but the relationship between location, molecules and structure offers a concrete route to understanding part of a hormonal response.