A prefrontal projection rapidly changes behavior after stress
After chronic stress in male mice, activity declines in a prefrontal projection to the anterior ventral bed nucleus. Activating it improves immobility and sucrose-preference measures, with local AMPA receptors contributing. Inhibition also weakens part of ketamine’s effect.
After prolonged stress, mice struggle less in challenging situations and show reduced preference for sweet water. What changes in the brain accompany these behaviors? A study published in iScience on September 12, 2023 follows the prelimbic prefrontal cortex (PrL) to the anterior ventral bed nucleus of the stria terminalis (avBNST), linking reduced activity after stress, behavioral effects of manipulating the projection, and ketamine’s rapid action. The question goes beyond increasing prefrontal activity in general to identifying a consequential output.
Activating glutamatergic PrL projections in the avBNST improves several depression-like behavioral measures in chronically stressed male mice. Local AMPA-receptor blockade weakens this improvement; projection inhibition diminishes but does not eliminate ketamine’s rapid behavioral effects.
Contents · 7 sections
The same stress produces different results across sexes
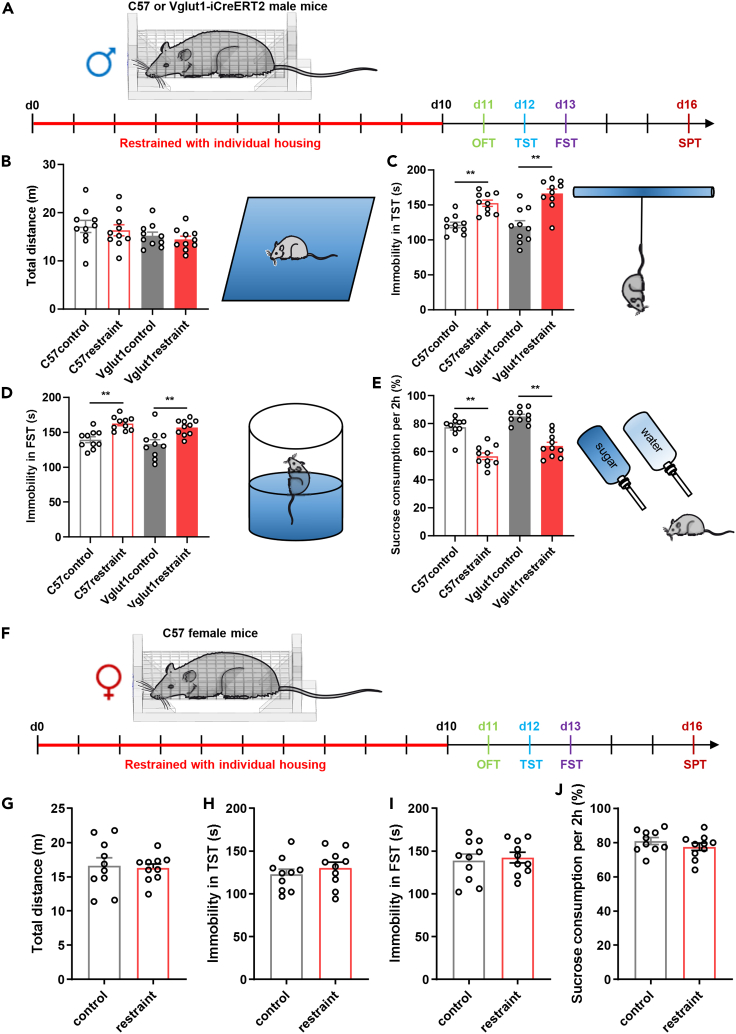
Combining chronic restraint with individual housing increases immobility in tail-suspension and forced-swim tests and reduces sucrose preference in males, without a significant change in open-field distance. This pattern appears in both male strains examined, providing the basis for the circuit study.
A separate female cohort shows no significant differences in these behavioral measures under the same paradigm. Subsequent circuit findings therefore mainly describe males under this stress condition. Sucrose preference measures choice of sweet water, while immobility measures behavior in particular situations; together they characterize the post-stress phenotype.
Source: Chen JY et al. · iScience · CC BY-NC-ND
Original figure and English caption ↗
Excitatory population signals during struggling decline
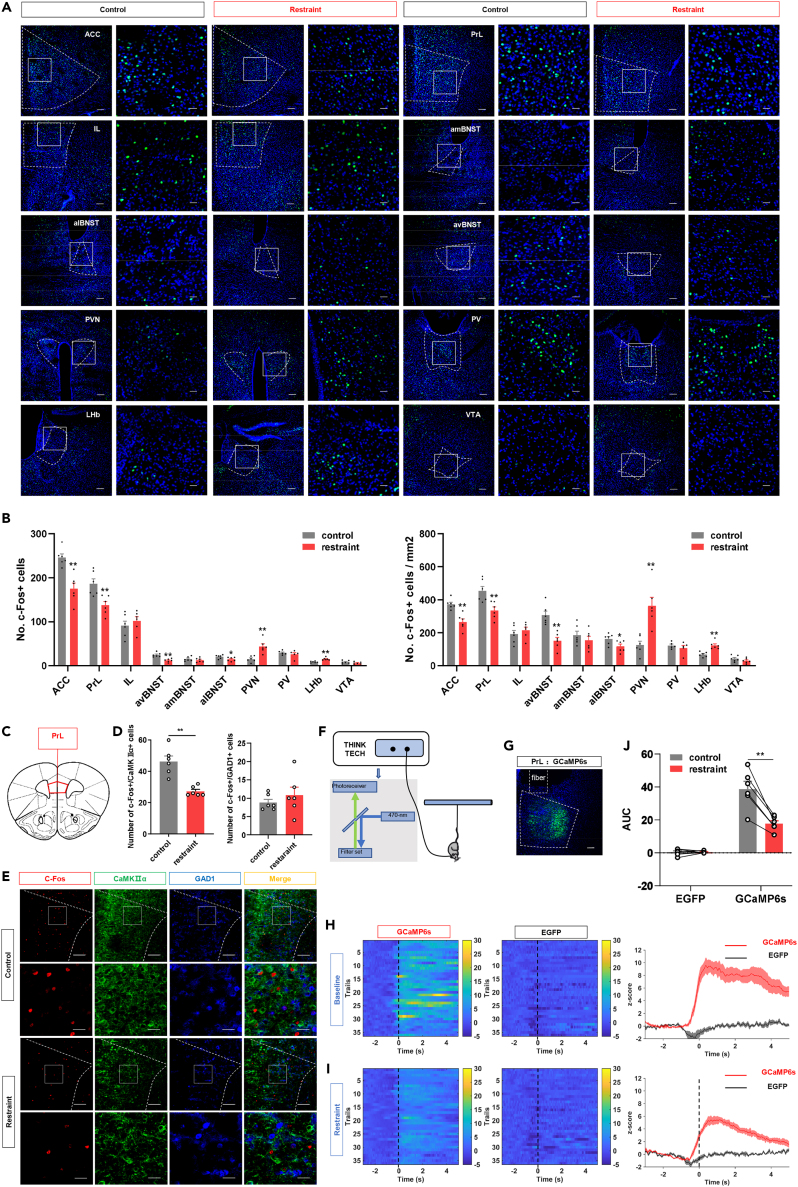
Among several emotion-related regions, both PrL and avBNST show reduced c-Fos activity labeling. In PrL, the reduction is evident in cells carrying an excitatory-neuron marker; c-Fos counts co-labeled with a GABAergic marker do not change significantly.
Calcium recordings place the labeling result within behavior. PrL glutamatergic population signals rise around struggle onset, but responses to these events become smaller after stress. Activating these PrL cells improves post-stress behavior, whereas inhibiting them in unstressed animals shifts the measures in the opposite direction.
Source: Chen JY et al. · iScience · CC BY-NC-ND
Original figure and English caption ↗
Most labeled avBNST recipients carry a GABA marker
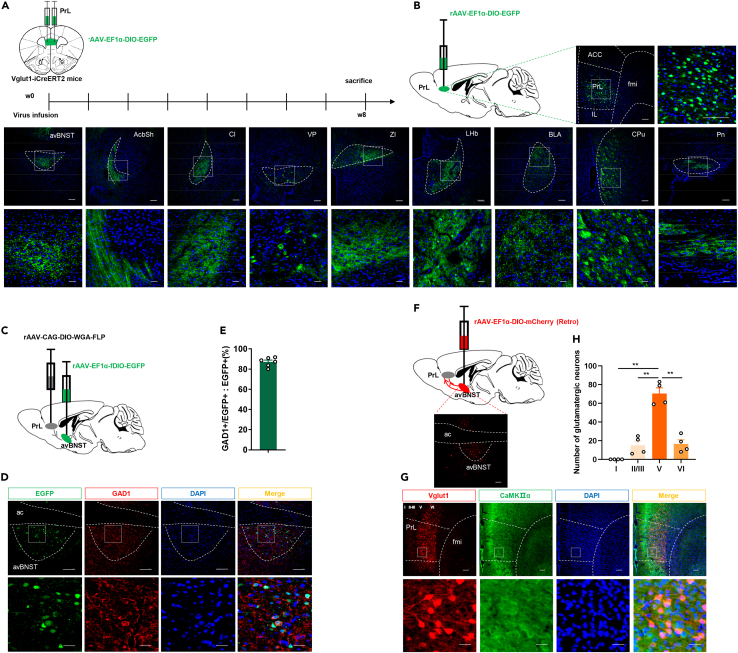
PrL output has more than one destination. Tracing reveals fibers in regions including the nucleus accumbens, amygdala and lateral habenula, as well as the avBNST. This bed-nucleus subregion, implicated in stress regulation, becomes the downstream focus.
About 87% of traced avBNST recipient cells co-label with GAD1, supporting a predominantly GABAergic recipient population. PrL neurons projecting there are enriched in cortical layer V. An excitatory cortical output is thus associated with a largely inhibitory downstream population; behavioral manipulation tests its consequences.
Source: Chen JY et al. · iScience · CC BY-NC-ND
Original figure and English caption ↗
Stronger input rapidly improves behavioral measures
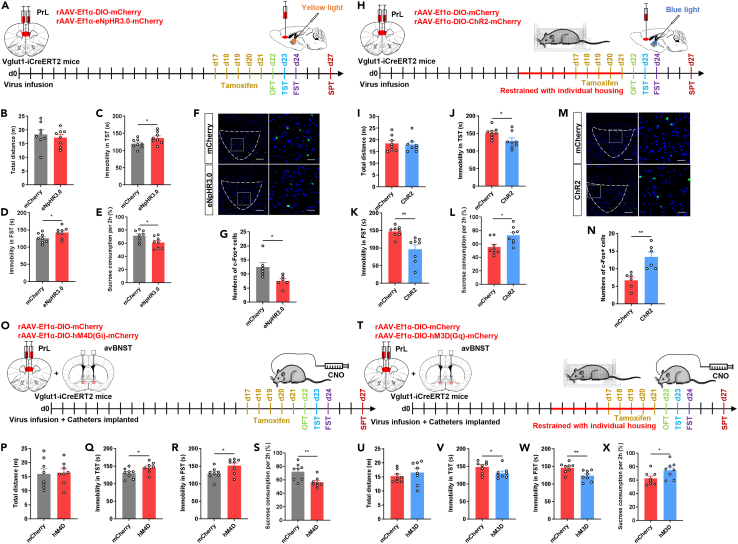
In stressed males, activating PrL terminals in avBNST reduces tail-suspension and swim immobility and increases sucrose preference. In unstressed males, inhibiting these terminals increases immobility and reduces sucrose preference. Optogenetic and chemogenetic manipulations produce consistent directions of change.
The behavioral shifts occur without a significant change in total open-field distance. avBNST c-Fos labeling also increases with stronger input and decreases with inhibition, showing that local downstream activity is influenced by this cortical projection.
Source: Chen JY et al. · iScience · CC BY-NC-ND
Original figure and English caption ↗
Local AMPA receptors contribute to improvement
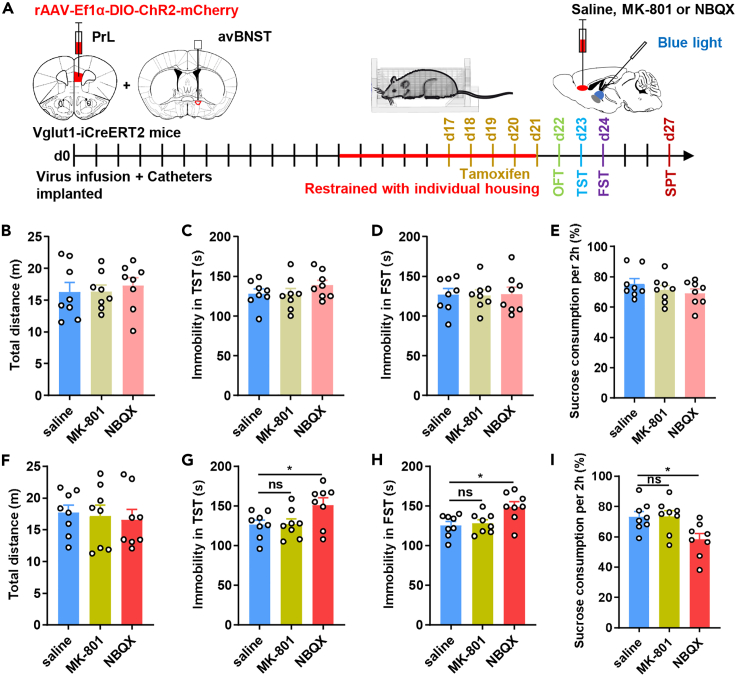
Which receptors contribute to the behavioral effect of the excitatory input in avBNST? Under weaker local blockade conditions, neither AMPA- nor NMDA-receptor antagonism significantly changes behavior during projection activation. Under stronger blockade, AMPA antagonism weakens improvement, whereas NMDA antagonism does not show the same effect.
The result links local AMPA receptors to the benefit of activating the projection. Because the antagonists act within the local avBNST network, the evidence identifies a behavioral receptor contribution rather than the transmission properties of each individual synapse.
Source: Chen JY et al. · iScience · CC BY-NC-ND
Original figure and English caption ↗
Projection inhibition weakens but does not erase the rapid drug effect
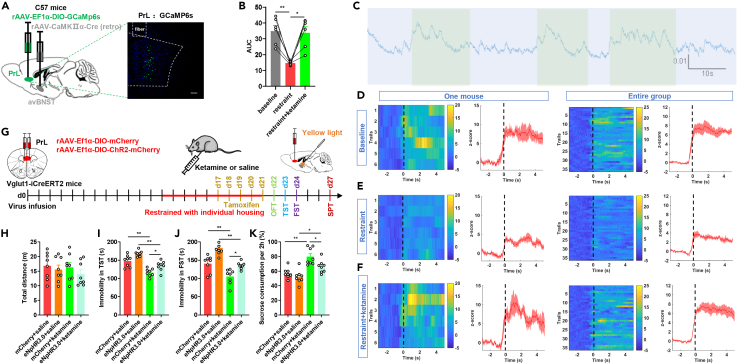
One day after ketamine, struggle-related calcium responses in avBNST-projecting PrL cells recover toward pre-stress levels. Recording this projection-defined population links the drug response to the previously reduced cortical activity.
In a separate rapid behavioral test, inhibiting the projection weakens ketamine’s reduction of immobility and increase in sucrose preference, but improvement does not disappear entirely. This connection contributes to part of the drug effect while other components remain active.
Source: Chen JY et al. · iScience · CC BY-NC-ND
Original figure and English caption ↗
Two population signals connect with post-stress behavior
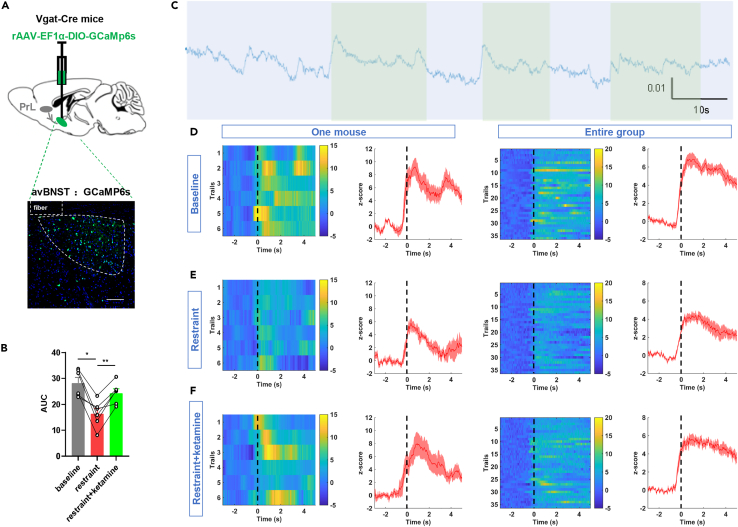
The researchers separately examine avBNST GABAergic populations. Their struggle-related calcium responses likewise decrease after stress and recover one day after ketamine. Similar state changes in the two populations add dynamic evidence for the connection’s role in behavioral regulation.
The study shows how prefrontal function can be resolved along a particular output: where excitatory cells send their signals matters for behavior. The evidence mainly concerns adult males; identifying the crucial avBNST recipients requires finer analysis of the participating cells.
Source: Chen JY et al. · iScience · CC BY-NC-ND
Original figure and English caption ↗