How does high-fat feeding reshape a midbrain feeding signal?
High-fat feeding reshapes more than fat stores. A mouse midbrain inhibitory population shows stronger feeding-related suppression, while changing its activity or a related gene shifts weight and energy balance.
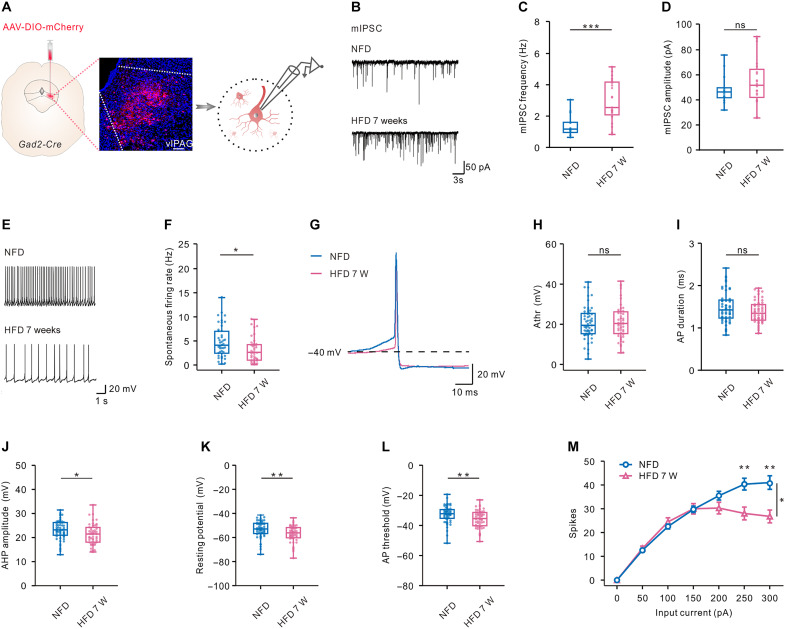
Eating more while expending less can increase body weight. Could adaptation inside the brain also make energy balance harder to maintain? A study published in Science Advances on November 1, 2023 followed GABAergic cells in the mouse ventrolateral periaqueductal gray, or vlPAG. Their population calcium signal fell during feeding, with stronger suppression after high-fat feeding. The study linked this pattern to inhibitory transmission, cellular excitability and gene expression, alongside changes in food intake and body fat.
Diet-induced obesity accompanies functional adaptation in vlPAG GABAergic cells. Increasing their activity or CACNA2D1 expression reduces body fat and weight in the mouse model and improves selected abnormal neural signals.
Contents · 6 sections
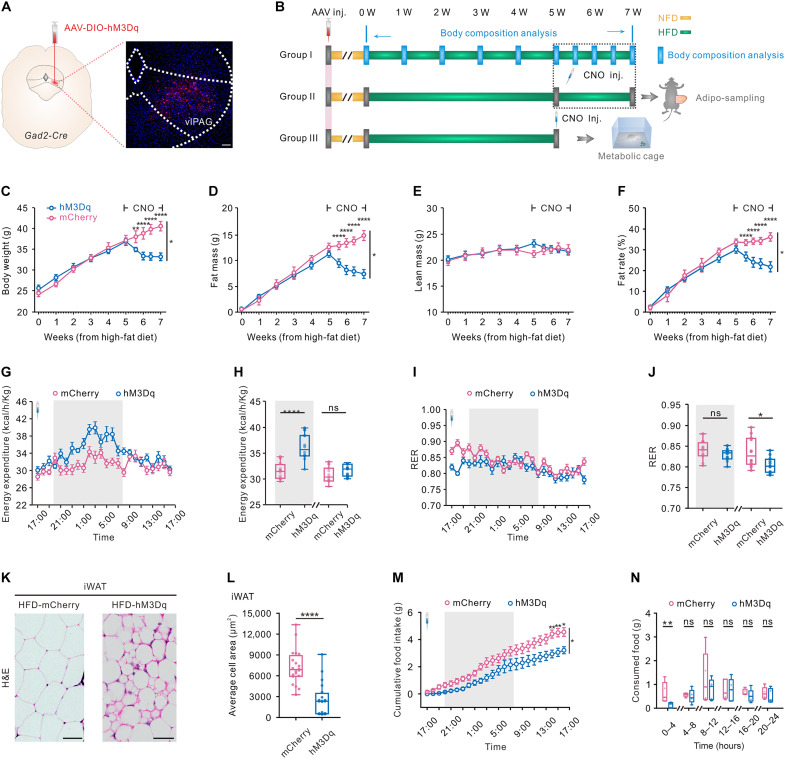
Weight loss accompanies less eating and greater nighttime expenditure
Sustained activation in mice with diet-induced obesity reduced weight, fat mass and fat percentage without a significant change in lean mass. Controls did not show the same trajectory, distinguishing fat-related changes from a general loss of body components.
High-fat food intake fell and nighttime energy expenditure rose, whereas daytime expenditure did not significantly increase. Inguinal white fat showed smaller adipocytes, increased UCP1 and browning features; other fat depots did not show the same UCP1 change. Effects therefore depended on time and tissue.
Source: Wang X et al. · Science advances · CC BY
Original figure and English caption ↗
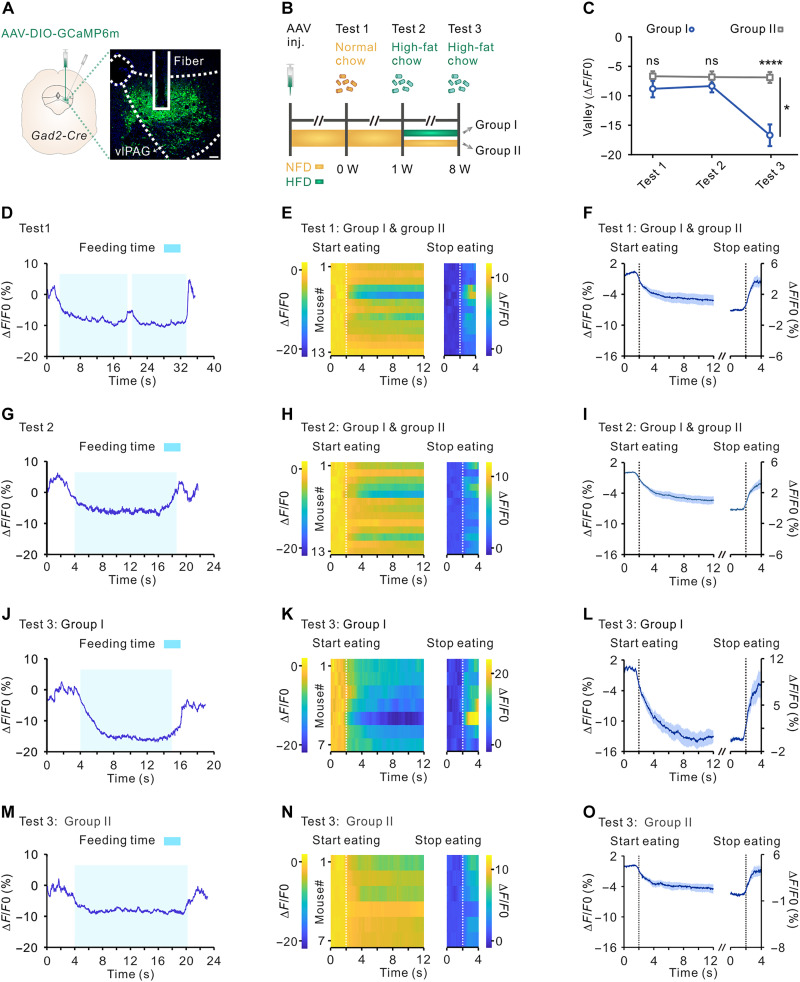
Stronger suppression extends beyond high-fat food itself
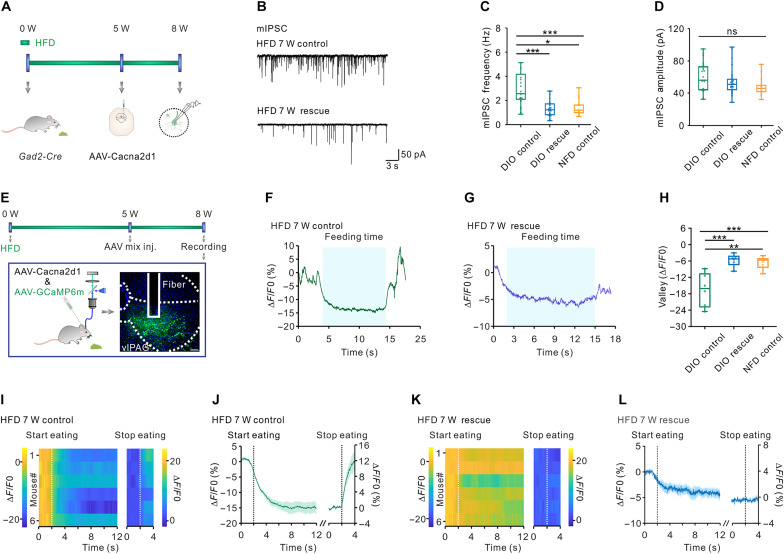
Calcium signals declined during normal-chow feeding and initial high-fat-food exposure, approaching baseline when feeding ended. After prolonged high-fat feeding, suppression was stronger than in normal-diet controls offered the same high-fat food.
Stronger suppression also appeared when obese mice ate normal chow, linking the pattern to dietary history and bodily state rather than immediate fat content alone. Walking, grooming and rearing did not produce the same calcium changes, and not every feeding-bout measure changed.
Source: Wang X et al. · Science advances · CC BY
Original figure and English caption ↗
More frequent inhibition accompanies lower excitability
Slice recordings revealed more frequent miniature inhibitory currents without a significant increase in their amplitude. Spontaneous firing fell and selected intrinsic electrical properties changed, adding synaptic and cellular evidence to the population calcium pattern.
Some early synaptic changes preceded clear weight gain, while intrinsic excitability changes were not yet fully evident. This temporal pattern complicates a purely passive consequence-of-obesity account and raises questions about how diet, metabolic signals and cellular adaptation interact.
Source: Wang X et al. · Science advances · CC BY
Original figure and English caption ↗
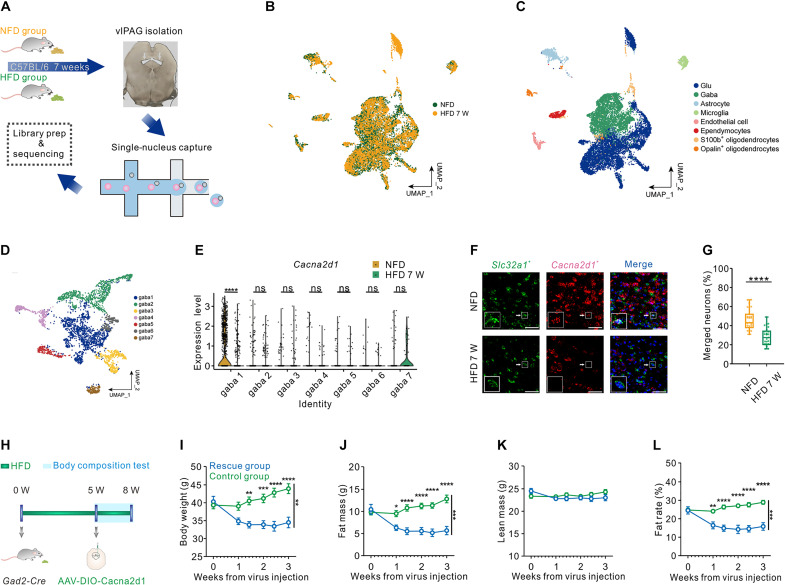
A CACNA2D1 change is concentrated in one subgroup
Single-nucleus profiling separated GABAergic cells into seven subgroups. Cacna2d1, encoding a calcium-channel auxiliary subunit, was reduced in one prominent subgroup; corresponding comparisons in the other six were not significant. Tissue RNA measurements supported reduced expression, revealing heterogeneity within the population.
Increasing CACNA2D1 expression in the relevant GABAergic population reduced weight, fat mass and fat percentage without significantly changing lean mass. This intervention was not restricted to the transcriptomic subgroup, so its effects cannot all be assigned to that subgroup alone.
Source: Wang X et al. · Science advances · CC BY
Original figure and English caption ↗
Excessive suppression eases while feeding responses remain
After increased CACNA2D1 expression, elevated inhibitory-current frequency decreased without a significant amplitude difference. Feeding still suppressed calcium signals, but excessive suppression eased toward normal-diet controls. Feeding responsiveness remained rather than becoming constant high activity. Total feeding time during recording decreased without significant changes in bout count or individual bout duration, further defining the behavioral effect.
Source: Wang X et al. · Science advances · CC BY
Original figure and English caption ↗
Energy balance includes adaptation in the midbrain
This study in adult male mice connects high-fat feeding, local neural adaptation and bodily energy balance. Feeding control involves dietary history as well as immediate food responses. Existing anatomical clues do not yet establish the downstream pathways responsible for feeding and adipose effects.
CACNA2D1 emerges as a molecular lead. Improvement in this mouse model remains distinct from a human weight-loss treatment; durability, subgroup contributions and how this auxiliary subunit alters local synapses remain open questions.